Crypto Futures
Crypto futures put two questions from Forward and Futures Markets and Forward and Futures Prices to a new kind of asset, neither a stock index nor a commodity: what holds the futures price to the cash price, and who bears the risk when nothing does? They also brought a new contract, the perpetual future, which never expires.
Bitcoin Futures
CME listed bitcoin futures in December 2017. Each contract is for 5 bitcoin and is cash settled against the CME CF Bitcoin Reference Rate, a daily dollar price of bitcoin computed from trades on several spot exchanges (CME Group 2017). Micro Bitcoin futures, for a tenth of one bitcoin, came later (Zacks Equity Research 2022).
Most crypto futures trade outside the regulated system, on crypto-native exchanges such as Binance and OKX, which allow much more leverage: in the sample of Schmeling et al. (2023), initial margins were below 2% of the position, against 50% at CME. In January 2022 these exchanges held 81% of the open interest in bitcoin futures.
Bitcoin does not deteriorate and needs no warehouse, so we might expect it to behave like a stock index, with the futures price equal to the cash price plus interest, as in Forward Price of a Non-Dividend Paying Asset. It does not. Schmeling et al. (2023) find that the futures premium over the cash price, which they call the basis, averaged about 10% a year from 2019 to 2022, well above the interest rate, and spiked above 40% a year on crypto-native exchanges. On CME it peaked near 30% in early 2021. Differences between dollar interest rates and the rates for borrowing bitcoin explain only about 2% of its variation.
The basis widens when small traders seek leveraged long exposure through futures, and arbitrage capital does not close the gap because the cash-and-carry trade is risky before maturity. At CME the arbitrageur holds the bitcoin elsewhere and posts dollars as margin on the short futures. If the futures price rises, the margin calls must be paid in dollars, and the bitcoin can pay them only if it is sold, which removes the hedge; an arbitrageur who cannot pay is liquidated before the two prices converge. Bitcoin thus sits between the two cases of The Spot Price: the stock index, whose basis arbitrage holds in place, and the physical commodity, whose basis it does not. Bitcoin is a financial asset that is cheap to hold, yet arbitrage holds its basis in place only loosely.
Perpetual Futures
The most traded crypto derivative is not a futures contract with a delivery date but a perpetual future, which never expires (He et al. 2024). Without an expiration date, nothing forces the futures price to converge to the cash price. Instead, the exchange anchors it with a funding rate: every few hours, typically every eight, the longs pay the shorts an amount proportional to the gap between the perpetual and the cash price, or the shorts pay the longs when the gap is negative. Ackerer et al. (2026) derive the no-arbitrage perpetual price and show that some funding rules make it equal to the cash price.
In the data the anchor is loose. An arbitrageur who buys bitcoin and shorts the perpetual collects funding but has no date on which the trade is sure to close at a profit, and He et al. (2024) find mean absolute gaps between perpetual and cash prices of 52% to 90% a year across cryptocurrencies, far larger than deviations from covered interest parity, though shrinking by about 22% a year as arbitrage capital has grown. These figures are annualized, and over the eight hours between funding payments a gap of that size is only a few basis points of the price, about the cost of trading it: the deviations are comparable to the no-arbitrage bounds that trading fees allow (He et al. 2024).
Convergence and the Price of Liquidity
Why should a payment between longs and shorts do the work of an expiration date? The Treasury market offers a close analogy. The papers on perpetual futures do not draw it, so what follows is our own argument, built on results from both literatures. When the Treasury auctions a new 30-year bond, the new bond becomes the benchmark, the most actively traded bond of its kind, and it trades at a higher price, and so a lower yield, than the bond issued six months earlier, although their cash flows are almost the same. In February 2001 the new bond yielded 12 basis points less than the old one, while the two previous issues differed by only 3 (Krishnamurthy 2002).
Part of the premium is a cash flow. The owner of a bond can lend it in the repo market through a repurchase agreement, a loan of cash secured by the bond: the owner hands over the bond, receives cash, and pays interest on the cash at the bond’s repo rate. When many traders want to borrow a particular bond, its repo rate falls below the general collateral rate, the rate on loans backed by any Treasury, and the bond is said to be special. The owner of a special bond borrows cash cheaply, a saving that Duffie (1996) describes as effectively an additional dividend yield. The bond’s price exceeds what it would be without specialness by the present value of these savings (Duffie 1996).
This is why arbitrage does not close the gap. A trader who shorts the expensive bond must first borrow it, by lending the cash from the sale to the bond’s owner against the bond. That cash earns the bond’s low repo rate instead of the general collateral rate, so the short position pays the specialness for as long as it is open. The trade earns money only if the narrowing of the gap exceeds the specialness paid while the trade is open, and more short sellers raise the demand to borrow the bond, which makes it more special. Krishnamurthy (2002) finds that from 1995 to 1999 the spread between the old and the new bond converged systematically over each auction cycle, yet a trade long the old bond and short the new one earned close to zero on average, because the repo cost absorbed the convergence.
To see what the funding rate does, strip the example down to two bonds from the same issuer with the same coupon and maturity, one special in repo and priced higher. An arbitrageur who buys the cheap bond and shorts the expensive one receives and pays the same coupons, and pays the specialness for as long as the trade is open. At maturity both bonds pay par, so the gap must close by then: today it is worth the present value of the specialness expected until maturity, and it shrinks as maturity approaches, just as a dated futures price converges to the cash price at expiration.
If the two bonds were perpetuities, nothing would force them together. The gap would then be the present value of specialness paid forever, the price of liquidity rather than an arbitrage, with no reason to shrink. A perpetual future without funding payments would be in the same position, trading at the present value of the convenience of leveraged exposure paid forever. The funding rate reverses who pays. In the bond market the arbitrageur pays the owner of the expensive bond while waiting for the gap to close; with funding, the holder of the expensive perpetual pays the arbitrageur, which pushes the gap toward zero.
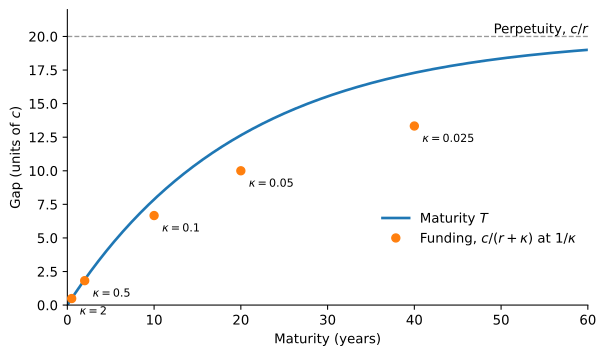
A simple calculation makes this precise. If the specialness of the liquid bond is a constant c per unit of time and the interest rate is r, the gap between two bonds with maturity T is \int_{0}^{T} c\, e^{-r t} dt = \frac{c}{r} \left(1 - e^{-r T}\right). \tag{1} The gap is close to zero a moment before maturity, grows with T, and tends to c / r for perpetuities. The perpetuity is the limit of the finite case: what the maturity date provides is a terminal condition, both bonds paying par, from which prices are worked out backward.
Funding payments restore such a condition. Ackerer et al. (2026) show that with funding intensity \kappa the perpetual future is priced as if it matured at a random date \tau, exponentially distributed with mean 1 / \kappa, where \kappa is the fraction of the gap paid as funding per unit of time. With a tenth of the gap paid every eight hours, as in Exercise 2, \kappa is about 0.3 \times 365 \approx 110 a year, so a perpetual is priced like a futures contract with a mean maturity of about three days. That is why it tracks the cash price far more closely than the dots in Figure 1, which use much smaller values of \kappa to keep the picture readable. The comparison assumes funding proportional to the gap; actual exchange rules also cap the payment and add a small fixed rate. Their result is about the futures price, not about a liquidity gap, but if we replace T by such a \tau in (1), the expected gap is \operatorname{E}\left[\frac{c}{r} \left(1 - e^{-r \tau}\right)\right] = \frac{c}{r + \kappa}, which equals c / r, the perpetuity, when \kappa = 0, and vanishes as \kappa \rightarrow \infty. Figure 1 plots both.
The bitcoin basis is only partly like the bond gap. Schmeling et al. (2023) read it as a convenience yield that traders get from holding futures, a service flow like the specialness of a bond. Unlike the bond trade, though, the bitcoin cash-and-carry trade does not cost the arbitrageur a specialness: what holds arbitrage back is margin risk, and on CME the trade earned a Sharpe ratio of about 0.6 (Schmeling et al. 2023), money that arbitrage leaves on the table because the trade is risky.
Spot-Quoted Futures
CME’s answer to the perpetual keeps the expiration date. Its Spot-Quoted futures, introduced in 2025 on bitcoin, ether, and the major stock indices, are small contracts, 0.01 bitcoin for example, that trade at the cash price and are long dated, so they need no monthly or quarterly roll (CME Group 2025). They have caught on since their launch in the summer of 2025, averaging 120,000 contracts a day in the fourth quarter (CME Group 2026).
The trick is in clearing. Each day CME adds to every position a total financing adjustment A_{t}, which moves each day by as much as the gap between the front-month futures price F_{t} and the cash price P_{t}. A position cleared at P_{t} + A_{t} therefore gains from one day to the next \Delta P_{t} + \Delta A_{t} = \Delta P_{t} + \Delta (F_{t} - P_{t}) = \Delta F_{t}, the gain on the front-month futures. The contract is quoted at the cash price, but its gains are those of the nearby contract, the spot price as we defined it in The Spot Price. No funding payment anchors it; the dated futures does.
When the futures trades above the cash price, the gap shrinks toward expiration, the adjustment falls, and a long position pays the carry that a perpetual would charge through funding. For bitcoin, the adjustment has cost a long position about 4 basis points of notional per trading day (CME Group 2026), roughly 10% a year, close to the crypto carry measured by Schmeling et al. (2023).
The table below collects the contracts of this note side by side, with the special Treasury bond that served as the analogy. It assumes that futures trade above the cash price, the usual case for bitcoin; when they trade below it, the shorts pay the carry. In the last row, c is the convenience of leveraged exposure for the futures and the specialness for the bond.
| Dated futures | Perpetual future | Spot-Quoted futures | Special Treasury bond | |
|---|---|---|---|---|
| Quoted at | Futures price | Perpetual price | Cash price | Bond price |
| Anchored by | Settlement at expiration | Funding payments | The front-month futures, through the adjustment | Payment of par at maturity |
| Convergence | Certain, at expiration | Never certain | Gains follow the front month, which converges | Certain, at maturity |
| Who pays the carry | Longs, as the premium shrinks | Longs pay shorts through funding | Longs, as the adjustment falls | Short sellers, through the repo rate |
| Roll | At each expiration | None | None for the trader | None |
| Gap with convenience flow c | \frac{c}{r}\left(1 - e^{-r T}\right) | \frac{c}{r + \kappa} | That of the front month | \frac{c}{r}\left(1 - e^{-r T}\right) |
Practice Problems
Problem 1 A trader buys 10 Spot-Quoted bitcoin futures, each for 0.01 bitcoin, at a cash price of $100,000 on Monday, and sells them at a cash price of $102,000 on Tuesday. The total financing adjustment is -1{,}500 on Monday. At Monday’s close the front-month futures settles at $101,000 and the cash price is $100,400. At Tuesday’s close they are $102,450 and $101,900. What is the total financing adjustment on Tuesday, and what is the trader’s profit?
Solution
The gap between the front-month futures and the cash price is 101{,}000 - 100{,}400 = 600 on Monday and 102{,}450 - 101{,}900 = 550 on Tuesday. The adjustment changes by the change in the gap, 550 - 600 = -50, so it is -1{,}500 - 50 = -1{,}550 on Tuesday. The position was cleared at 100{,}000 - 1{,}500 = 98{,}500 on Monday and closed at 102{,}000 - 1{,}550 = 100{,}450 on Tuesday, a gain of $1,950 per bitcoin. Ten contracts cover 0.1 bitcoin, so the profit is 0.1 \times 1{,}950 = \$195. The $2,000 rise in the cash price is reduced by $50 of carry, the narrowing of the gap between the futures and the cash price.Problem 2 A bitcoin perpetual trades at $100,300 while the cash price is $100,000. Every eight hours the exchange makes longs pay shorts one tenth of the gap between the two prices, per bitcoin. A trader buys 1 bitcoin and shorts 1 perpetual.
- How much funding does the trader collect in one day if the gap stays at $300? What is that as an annual rate of the cash price?
- The gap stays at $300 during the day, and the trader closes both positions at the end of the day. What is the profit if the gap has narrowed to $100 at the close, and if it has widened to $800?
Solution
- Each payment is 0.1 \times 300 = \$30, and three payments a day give $90. As a fraction of the cash price, that is 90 / 100{,}000 = 0.09\% a day, or 0.09\% \times 365 = 32.9\% a year.
- The trader is long bitcoin and short the perpetual, so they gain when the gap narrows. If it narrows from $300 to $100, the positions gain $200, and with $90 of funding the profit is $290. If it widens to $800, the positions lose $500, and the profit is 90 - 500 = -\$410. Funding is collected for sure, but with no expiration date nothing forces the gap to close before the trader has to.
Problem 3 A trader buys bitcoin futures for 1 bitcoin at $100,000. On a crypto-native exchange the initial margin is 2% of the position, and at CME it is 50%. Ignoring maintenance margins, at what futures price is the margin deposit wiped out on each exchange? If the daily volatility of bitcoin is 3%, how many daily standard deviations away is that price?
Solution
The deposit is $2,000 on the crypto-native exchange and $50,000 at CME. A long position loses $1 for every $1 fall in the futures price, so the deposit is gone at $98,000 on the crypto-native exchange and at $50,000 at CME. The first is a 2% fall, 2 / 3 = 0.67 daily standard deviations, a move that happens most weeks. The second is a 50% fall, about 17 daily standard deviations. High leverage turns ordinary price moves into liquidations.Problem 4 A newly issued 30-year Treasury bond is special in the repo market: its repo rate is 0.6% a year below the general collateral rate, and it is expected to stay special for six months, until the next auction. The interest rate is 5% a year, continuously compounded. By how much does the specialness raise the bond’s price, per $100 of price? What would the premium be if the specialness lasted forever?
Solution
The owner saves c = 0.6 per $100 a year for T = 0.5 years, so by (1) the premium is \frac{0.6}{0.05} \left(1 - e^{-0.05 \times 0.5}\right) = \$0.30 per $100. If the specialness lasted forever, the premium would be c / r = 0.6 / 0.05 = \$12 per $100. The maturity of the specialness, not its size, makes the difference.Problem 5 Ten days before expiration, a CME bitcoin futures contract trades at $102,000 and the cash price is $101,500.
- What is the annualized basis, \ln(F / S) \times 365 / 10?
- Suppose the cash price is measured a few hours away from the futures price, so it could be anywhere from $101,300 to $101,700. What range of annualized bases does that imply? What would the range be one day before expiration, with the same prices?
- What is \ln(F / S) at expiration, measured against the CME CF Bitcoin Reference Rate?
Solution
- \ln(102{,}000 / 101{,}500) \times 365 / 10 = 17.9\% a year.
- With a cash price of $101,700 the basis is \ln(102{,}000 / 101{,}700) \times 36.5 = 10.8\%, and with $101,300 it is 25.1%. One day before expiration the multiplier is 365 instead of 36.5, and the range becomes 108% to 251% a year. An error of 0.2% in the cash price moves the annualized basis by about 7 percentage points ten days out and by about 70 points one day out: dividing by the time to expiration amplifies the noise.
- Zero. The contract is cash settled at the reference rate, so at expiration the futures price equals it by definition. What converges is \ln(F / S), not its annualized value.