Class 8
The Model
The Markowitz problem of Class 5 needs the whole covariance matrix. For N stocks that is N(N+1)/2 variances and covariances, which for the S&P 500 means 500 \times 501 / 2 = 125{,}250 estimates, far more than any sample can support. The single index model cuts this down by assuming that stocks move together only through the market. Writing R_{i} = r_{i} - r_{f} and R_{M} = r_{M} - r_{f} for excess returns, R_{i} = \alpha_{i} + \beta_{i} R_{M} + e_{i}, \tag{1} with \operatorname{E}(e_{i}) = 0, \operatorname{Cov}(R_{M}, e_{i}) = 0, and, crucially, \operatorname{Cov}(e_{i}, e_{j}) = 0 for any two distinct stocks. The line y = \alpha_{i} + \beta_{i} x is the security characteristic line of stock i. Running the regression of R_{i} on R_{M} delivers \beta_{i} = \frac{\operatorname{Cov}(R_{i}, R_{M})}{\operatorname{V}(R_{M})} = \frac{\sigma_{i} \rho_{i,M}}{\sigma_{M}}, \qquad \alpha_{i} = \operatorname{E}(R_{i}) - \beta_{i} \operatorname{E}(R_{M}). \tag{2} Note that \beta_{i} is the same quantity that prices the asset in Class 7. The difference is that the CAPM predicts \alpha_{i} = 0, while the regression lets the data speak: a positive \alpha_{i} means the stock earned more than its beta exposure warranted.
Variance Decomposition and R-Squared
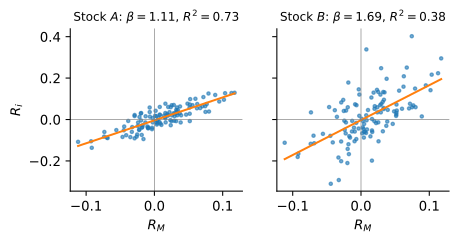
Since e_{i} is uncorrelated with the market, the two terms in (1) contribute separately to total variance: \sigma_{i}^{2} = \underbrace{\beta_{i}^{2} \sigma_{M}^{2}}_{\text{systematic}} + \underbrace{\sigma^{2}(e_{i})}_{\text{firm-specific}}. \tag{3} The share of the total that is systematic is the regression’s R-squared, \text{R-squared} = \frac{\beta_{i}^{2} \sigma_{M}^{2}}{\sigma_{i}^{2}} = 1 - \frac{\sigma^{2}(e_{i})}{\sigma_{i}^{2}} = \rho_{i,M}^{2}, \tag{4} where the last equality follows from substituting \beta_{i} = \sigma_{i} \rho_{i,M} / \sigma_{M}. Beta and R-squared measure different things. Beta is the slope of the security characteristic line, how much the stock moves for a given market move; R-squared is the tightness of the scatter around that line, how much of the stock’s variance the market explains. A stock can have a large beta and a low R-squared, as Figure 1 shows.
Covariance Structure
The real economy of the model shows up in the covariance between two stocks. Using (1) and \operatorname{Cov}(e_{i}, e_{j}) = 0, \operatorname{Cov}(R_{i}, R_{j}) = \beta_{i} \beta_{j} \sigma_{M}^{2}, \qquad \text{or} \qquad \rho_{i,j} = \rho_{i,M} \, \rho_{j,M}. \tag{5} Two stocks covary only to the extent that both are exposed to the market, and their correlation is just the product of their correlations with the market. To fill in the entire covariance matrix we now need only \beta_{i} and \sigma^{2}(e_{i}) for each stock plus \sigma_{M}^{2}: for the S&P 500 that is 2 \times 500 + 1 = 1{,}001 estimates instead of 125{,}250.
The simplification is not free. Setting \operatorname{Cov}(e_{i}, e_{j}) = 0 rules out any common factor other than the market, so two oil companies or two regional banks will covary more than (5) predicts. Multifactor models add further indices to capture exactly this. The single index model also fails by construction when two assets are perfectly correlated: if R_{B} = w R_{A}, then e_{B} = w e_{A}, and their residuals cannot be uncorrelated.
Practice Problems
You regress the monthly excess returns of stock A on the monthly excess returns of the market and obtain \alpha_{A} = 0.4\%, \beta_{A} = 1.3, and an R-squared of 0.36. The volatility of the market is 5% per month.
- Compute the volatility of A and the volatility of its firm-specific return.
- What is the correlation between A and the market?
- If the expected excess return of the market is 0.7% per month, what was the average excess return of A over the sample?
Stocks A and B satisfy the single index model with \beta_{A} = 0.8, \beta_{B} = 1.6, \sigma(e_{A}) = 25\%, and \sigma(e_{B}) = 40\% per year. The market volatility is 20% per year.
- Compute \sigma_{A}, \sigma_{B}, and the correlation between the two stocks.
- Compute the volatility of a portfolio invested 50% in each stock, and its beta.
- Compare the portfolio’s firm-specific volatility with that of the individual stocks. What does the comparison illustrate?