How Long Until a Bond Trades Twice?
The Question
Most corporate bonds trade only a few times a day, many not at all. If customer trades in a bond arrive as a Poisson process with rate \lambda, the times between trades are independent exponentials, and the waiting time W until the second trade is \text{Gamma}(2, \lambda), as in Class 2. We fit a \text{Gamma}(\alpha, \lambda) distribution to one day of bond trades and leave \alpha free: an estimate near 2 supports Poisson arrivals.
Data and Method
Enhanced TRACE, available through WRDS, reports every trade in a US corporate bond with its execution time to the second. We use Wednesday, October 15, 2025, keep only trades with customers, and include the 31,603 bonds that had a customer trade in the previous month. Bonds trade over the counter through dealers, so there is no opening bell, but almost no trades happen before 8:00 a.m. Eastern, and we measure time in hours from then to the 5:00 p.m. close.
Only 25% of the bonds trade twice that day. For the others we only know that W exceeds the time we watched, and they enter the likelihood through \operatorname{P}(W > T); dropping them would keep only the active bonds. We estimate \alpha and \lambda by maximum likelihood (Table 1).
| Model | \hat\alpha | 95% interval | Rate to 9:30 | Rate after |
|---|---|---|---|---|
| 8:00 to 9:30, one rate | 1.66 | [1.51, 1.82] | 0.0741 | |
| Whole day, one rate | 1.30 | [1.26, 1.33] | 0.0538 | |
| Whole day, jump at 9:30 | 0.79 | [0.76, 0.81] | 0.0033 | 0.0230 |
Results
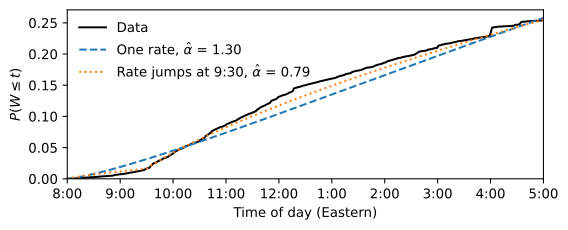
- Before the stock market opens at 9:30, \hat\alpha is 1.66, close to the Poisson value of 2, although the interval excludes it.
- With one rate for the whole day, \hat\alpha drops to 1.30 and the fitted curve has the wrong shape (Figure 1): it rises too early and too slowly, because trading picks up when the stock market opens.
- Letting the rate jump at 9:30 fixes the shape, with a rate about 7 times higher after the jump. But \hat\alpha falls to 0.79, further from 2.
What It Means
A shape parameter below 1 means that waiting times are more dispersed than a single Poisson rate allows, which is what mixing slow and fast bonds produces. The trade counts agree: with a common rate, the number of trades per bond would be Poisson, with variance equal to its mean, yet the mean is 2.2 trades and the variance 194. The Poisson model can still describe each bond, but each bond needs its own rate, driven by characteristics such as issue size, age and rating. The full analysis has the code and the details of the estimation.