Where Does cos(B) Spend Its Time?
The Question
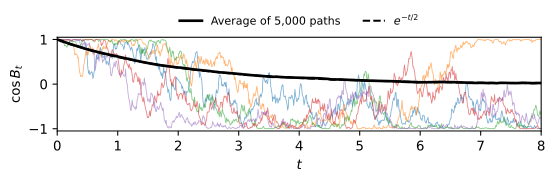
The process \cos(B_{t}) starts at 1 and stays in [-1, 1]. Its mean is the real part of the characteristic function of B_{t} \sim \mathcal{N}(0, t) (Class 3), \operatorname{E}(e^{i B_{t}}) = e^{-t/2}, \qquad \text{so} \qquad \operatorname{E}(\cos B_{t}) = e^{-t/2} \to 0. \tag{1} Itô’s formula (Class 8) gives the same answer: M_{t} = e^{t/2} \cos B_{t} has \mathop{}\!\mathrm{d}M_{t} = -e^{t/2} \sin B_{t} \mathop{}\!\mathrm{d}B_{t}, so M is a martingale and \operatorname{E}(\cos B_{t}) = e^{-t/2} \operatorname{E}(M_{t}) = e^{-t/2}. Does a mean of zero mean that \cos B_{t} settles near zero? We simulate 5,000 paths and find the opposite.
Where the Cosine Spends Its Time
Think of e^{i B_{t}} as a point on the unit circle with angle B_{t}. As t grows, the angle modulo 2\pi becomes uniform, and if \Theta is uniform then \operatorname{P}(\cos \Theta \leq x) = 1 - \arccos(x) / \pi, the arcsine law with density g(x) = \frac{1}{\pi \sqrt{1 - x^{2}}}, \qquad -1 < x < 1. \tag{2} The density is lowest at 0 and blows up at \pm 1: the cosine is flat at the top and bottom of the circle and steep at the sides, so it lingers near \pm 1 and rushes through 0. The circle is compact, so the same law also describes the fraction of time a single path spends in each region.
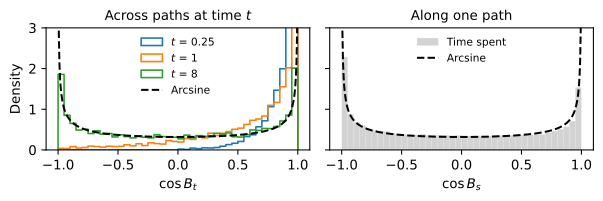
Along that path, |\cos B_{s}| > 0.9 for 27% of the time and |\cos B_{s}| < 0.1 for only 7%, two sets of the same length; the arcsine law gives 29% and 6%. The mean is zero because the visits to +1 and -1 cancel, not because the cosine sits near 0.
The Path on the Cylinder
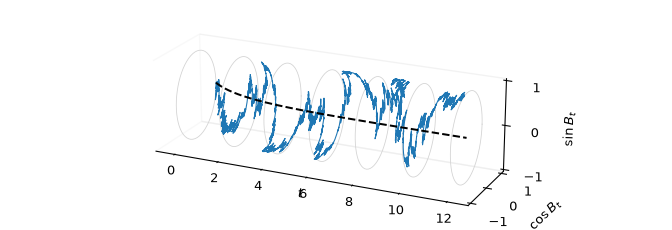
Plotting e^{i B_{t}} against time gives the curve (t, \cos B_{t}, \sin B_{t}) on a cylinder of radius one (Figure 3). The path winds back and forth at random and never leaves the surface, since |e^{i B_{t}}| = 1. The mean e^{-t/2} from (1) heads straight for the axis, because the paths spread evenly around the circle.