Problem Set 2
Investment Theory
Instructions: This problem set is due on Wednesday 9/16 at 11:59 pm CST and is an individual assignment. All problems must be handwritten. Scan your work and submit a PDF file.
Problem 1 Every January, Kestrel Wealth Partners publishes the capital-market forecasts its advisers must use for the year ahead. This year’s numbers are an expected return on the market portfolio of 10.5% with a volatility of 16%, and a risk-free rate of 2.5%. Every portfolio the firm recommends mixes the market portfolio with T-bills, and clients may borrow at the risk-free rate, so all such portfolios lie on the capital market line.
- What is the Sharpe ratio of the market portfolio under these forecasts?
- Linda wants her portfolio to have a volatility of 12%. What fraction of her wealth should she hold in the market portfolio, and what expected return can the firm offer her?
- A second client, Desmond, wants an expected return of 11.5%. What position in the market portfolio does that require, and what volatility does it carry? Interpret the weight you obtain and explain what Desmond must do to achieve it.
Problem 2 Two clients of the same advisory firm complete the identical risk questionnaire. Thomas scores a risk-aversion coefficient of A = 2, while Edith scores A = 6. Both are shown the same balanced fund, which the firm forecasts will earn an expected return of 11% with a volatility of 20%. T-bills currently yield 2.5%. Both clients rank portfolios using the utility function U = \mu - 0.5 A \sigma^{2}, where \mu and \sigma are expressed as decimals rather than percentages.
- Compute each client’s utility score for the balanced fund, and interpret the two numbers as certainty equivalents.
- If each client had to choose between the balanced fund and T-bills alone, what would each one do? Explain why the same fund can be attractive to one investor and unattractive to the other.
- Edith is currently indifferent between the portfolio she already owns (which is not the balanced fund) and a sure return of 4%. What expected return would a portfolio with a volatility of 10% have to offer for her to be just as well off holding it instead?
Problem 3 You run a boutique fund whose returns you forecast at 14% per year with a volatility of 25% per year. Your clients can also invest in T-bills, which yield 4% per year. Each client chooses the mix of your fund and T-bills that maximizes U = \mu - 0.5 A \sigma^{2}, where A is the client’s risk-aversion coefficient.
- Your first client, Harold, has a risk-aversion coefficient of A = 3. What fraction of his wealth should he place in your fund?
- What are the expected return and volatility of Harold’s optimal portfolio, and what utility score does it deliver?
- A second client, Ingrid, is twice as risk-averse as Harold, with A = 6. Before computing anything, use the formula for the optimal weight to predict how her allocation to your fund should compare with Harold’s. Then verify your prediction.
Problem 4 Sitting down with a new client, an adviser sketches the picture below. The client has only two things to invest in: a savings account paying a certain 4%, marked F on the sketch, and a single risky asset B that the firm forecasts will earn 12% with a volatility of 20%. Every portfolio the client can build from the two lies on the straight line joining F and B.
The four curves are the client’s own indifference curves, drawn from the utility function U = \mu - 0.5 A \sigma^{2} and numbered so that a higher number means a happier client. Curve 1 cuts the straight line, curve 2 grazes it exactly once at the point marked P, and curves 3 and 4 float above it without ever making contact. The points C and D both lie on curve 4.
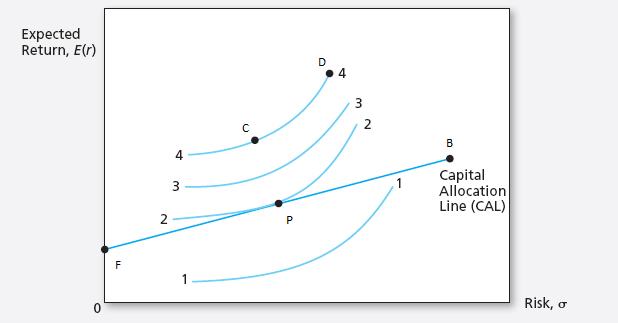
- How does the client rank C against D? Why can she not simply aim for one of them? Which of the four curves is the best she can actually reach, and what should the adviser say about each of the other three?
- The adviser eventually recommends putting half of the client’s wealth into B, which is the portfolio marked P in the sketch. For that recommendation to be the utility-maximizing one, what risk-aversion coefficient must the client have?
Problem 5 You manage a risky fund with an expected return of 15% and a volatility of 24%. T-bills yield 3%. Your client, Ravi, puts 60% of his savings in your fund and the remaining 40% in a T-bill money market account.
What are the expected return and volatility of Ravi’s overall portfolio?
Your fund holds only three stocks, in the following proportions:
Asset Proportions Stock A 30% Stock B 45% Stock C 25% Looking through the fund to the underlying stocks, what are the investment proportions of Ravi’s overall portfolio, including his position in T-bills? Verify that they sum to 100%.
Compute the Sharpe ratio of your fund and the Sharpe ratio of Ravi’s overall portfolio. Ravi worries that holding 40% in T-bills has cost him in risk-adjusted terms. Is he right? Explain what your answer implies about which decision actually determines an investor’s reward-to-risk ratio.
Problem 6 The investment committee of a small college endowment is choosing between two managers. The Cascade Fund is the steadier of the two, with a forecast expected return of 10% and a volatility of 16%. The Ridgeline Fund is more aggressive, with an expected return of 17% and a volatility of 28%. What caught the committee’s attention is that the two funds tend to move against each other: the correlation between their returns is -0.15.
- One member proposes splitting the endowment evenly between the two funds. What expected return and volatility would that portfolio have?
- Another member argues the committee should instead find the combination of the two funds with the smallest possible volatility. Find the weights of that portfolio, and compute its expected return and volatility.
- Compare the volatilities you found in parts a and b with the volatility of each fund on its own. What makes it possible for even the simple 50/50 split to be less volatile than either fund held alone?
Problem 7 A quantitative research team is studying how far diversification can go. The stocks in their universe each have a return variance of 0.25, and the average covariance between any two of them is 0.04. The team builds equally-weighted portfolios from this universe.
- What is the volatility of an equally-weighted portfolio of 20 of these stocks?
- What volatility does the equally-weighted portfolio approach as the number of stocks grows without bound?
- Interpret the limit you found in part b. What risk is the investor left holding after diversifying as much as possible, and why does that risk not disappear?
Problem 8 Camila has $4,500,000 invested in a fully diversified portfolio that her adviser forecasts will earn 7.5% per year with a volatility of 11%. Her employer, Northwind Materials, has just vested $1,500,000 of company stock in her name, bringing her total wealth to $6,000,000. Her adviser forecasts that Northwind stock will earn 16% per year with a volatility of 30%, and estimates a correlation of 0.20 between Northwind stock and Camila’s diversified portfolio. T-bills yield 3.5%.
- Suppose Camila keeps the Northwind shares. What are the expected return and volatility of her new $6,000,000 portfolio?
- Suppose instead she sells the shares and puts the entire $1,500,000 into T-bills. What are the expected return and volatility of that portfolio?
- Selling the shares lowers both Camila’s expected return and her volatility. Which of the two portfolios should she prefer? Explain what the answer depends on.
- A colleague suggests a third option: sell the Northwind shares and use the $1,500,000 to buy stock in Sable Chemical, which the adviser forecasts will have exactly the same expected return and volatility as Northwind. The colleague argues that “it makes no difference whether she keeps Northwind or switches to Sable.” Is the colleague right? Justify your answer.