Problem Set 2
Investments
Instructions: This problem set is due on Tuesday 2/10 at 11:59 pm CST and is an individual assignment. All problems must be handwritten. Scan your work and submit a PDF file.
Bond Arbitrage
Problem 1
Consider the following risk-free securities available to buy or sell to all investors in the market.
Security Price (t=0) Cash Flow (t=1) Cash Flow (t=2) Cash Flow (t=3) A 47 40 10 B 45 30 20 C 26 30 D ? 120 120 120 - What should be the no-arbitrage price of security D?
- If security D is trading at 400, is there an arbitrage opportunity? If so, explain how to exploit it.
Forward Rates
Problem 2 Below is a list of prices for $1,000 par zero-coupon bonds of various maturities.
| Bond | Maturity (years) | Price ($) |
|---|---|---|
| Z(1) | 1 | 930 |
| Z(2) | 2 | 850 |
| Z(3) | 3 | 770 |
| Z(4) | 4 | 700 |
- Compute the zero-coupon rates for years 1, 2, 3 and 4. Express the rates per year with annual compounding.
- Consider an 8% coupon $1,000 par bond (denoted by B) paying annual coupons and expiring in 4 years. Compute the no-arbitrage price of the bond and its yield-to-maturity.
- If the expectations hypothesis holds, what is your forecast for the 3-year interest rate (per year compounded annually) expected next year?
- If bond B was trading today for $985, is there an arbitrage opportunity that can be exploited? If so, explain how an investor would exploit such a strategy, i.e. indicate which securities the investor would buy or sell, as well as the quantities.
Problem 3 Below is a list of zero-coupon rates expressed per year with annual compounding for various maturities:
| Maturity (years) | 1 | 2 | 3 |
|---|---|---|---|
| Zero Rate | 10% | 9% | 8% |
- Compute the prizes of zero-coupon bonds ($1,000 face value) with maturities 1, 2 and 3 years.
- Compute the current forward rates (per year with annual compounding) from years 1 to 2, from 2 to 3 and from 1 to 3.
- Consider an 8.5% coupon ($1,000 face value) bond paying annual coupons and expiring in 3 years. Compute the no-arbitrage price of the bond.
- If at the end of the first year the yield curve flattens out at 10% for all maturities, what will be the 1-year holding-period return (per year with continuous compounding) on the coupon bond?
- If the coupon bond described in c. was instead trading today for $1,000, is there an arbitrage opportunity? If so, explain how an investor would exploit such a strategy, i.e. indicate which securities the investor would buy or sell, as well as the quantities.
Interest Rate Risk
Problem 4 An insurance company must make payments to a customer of $10 million in 5 years and $25 million in 30 years. The yield curve is flat at 8% per year with annual compounding.
- What is the present value and duration of its obligation?
- If it wants to fully fund and immunize its obligation to this customer with a single issue of a zero-coupon bond, what maturity bond must it purchase?
- Suppose you buy a zero-coupon bond with value and duration equal to your obligation, and that rates immediately increase to 9%. What happens to your net position, that is, to the difference between the value of the bond and that of your insurance obligation?
Problem 5 An insurance company must make payments to a customer of $20 million in 10 years and $40 million in 20 years. The yield curve is flat at 6% per year with annual compounding.
What is the present value and duration of its obligation?
If it wants to fully fund and immunize its obligation to this customer with a single issue of a zero-coupon bond, what zero-coupon bond must it purchase? Specify the maturity and face value of the bond.
Suppose that instead of using a single zero-coupon bond as in part b, the insurance company plans to use the following bonds to immunize its exposure to interest rate risk:
Bond Duration (years) B_{5} 5 B_{30} 30 Determine the total amount to invest in each bond that the insurance company must buy to immunize its obligation.
Capital Allocation
Problem 6 Consider the following information about a risky portfolio that you manage, and a risk-free asset: \mu_{Q} = 11\%, \sigma_{Q} = 15\%, r_{f} = 5\%.
- Your client wants to invest a proportion of her total investment budget in your risky fund to provide an expected rate of return on her overall or complete portfolio equal to 8%. What proportion should she invest in the risky portfolio, P, and what proportion in the risk-free asset?
- What will be the standard deviation of the rate of return on her portfolio?
- Another client wants the highest return possible subject to the constraint that you limit his standard deviation to be no more than 12%. Which client is more risk-averse?
Problem 7 Investment Management Inc. (IMI) uses the capital market line to make asset allocation recommendations. IMI derives the following forecasts:
- Expected return on the market portfolio: 12%.
- Standard deviation on the market portfolio: 20%.
- Risk-free rate: 5%.
Samuel Johnson seeks IMI’s advice for a portfolio asset allocation. Johnson informs IMI that he wants the standard deviation of the portfolio to equal half of the standard deviation for the market portfolio. Using the capital market line, what expected return can IMI provide subject to Johnson’s risk constraint?
Problem 8 Assume that you manage a risky portfolio with an expected rate of return of 18% and a standard deviation of 28%. The T-bill rate is 8%. Your client’s degree of risk aversion is A = 3.5, assuming a utility function U = \mu - 0.5 A \sigma^2.
- What proportion of the total investment should be invested in your fund?
- What is the expected return on your client’s optimized portfolio?
- What is the standard deviation on your client’s optimized portfolio?
Problem 9 Consider the following graph that plots four indifference curves of an investor with utility score given by U = \mu - 0.5 A \sigma^{2}.
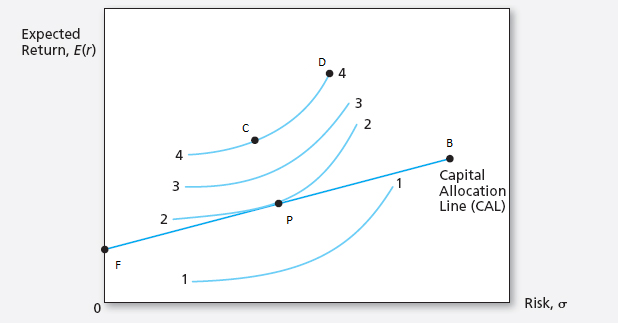
Currently, the investor can only invest in the risk-free asset denoted by F, and a risky asset denoted by B. You know that \mu_{B} = 11\%, \sigma_{B} = 15\%, and that the risk-free asset yields 5%.
- Which indifference curve (1, 2, 3, or 4) represents the greatest level of utility that can be achieved by the investor? Why?
- For which value of the risk-aversion coefficient would the optimal portfolio chosen by the investor be composed of 50% in the risky asset?
Problem 10 Assume that you manage a risky portfolio with an expected rate of return of 18% and a standard deviation of 28%. The T-bill rate is 8%. Your client chooses to invest 70% of a portfolio in your fund and 30% in a T-bill money market fund.
What is the expected value and standard deviation of the rate of return on his portfolio?
Suppose that your risky portfolio includes the following investments in the given proportions:
Asset Proportions Stock A 25% Stock B 32% Stock C 43% What are the investment proportions of your client’s overall portfolio, including the position in T-bills?
What is the reward-to-volatility ratio, i.e. the Sharpe ratio, of your risky portfolio and your client’s portfolio?