The Term Structure in the Data
Investment Theory
Fall 2026
The Question
- Forward rates contain an expected future short rate and a term premium: f_{t}(n - 1, n) = \operatorname{E}_{t}\left( y_{t + n - 1}(1) \right) + \mathit{TP}_{t}(n).
- The term premium is the expected excess return of a long bond over a short one.
- The expectations hypothesis: the term premium is zero, or constant.
- This chapter takes the hypothesis to the data:
- How much have long-term Treasuries earned?
- Do forward rates forecast short rates or bond returns?
- How have term premia and the risk of bonds changed?
Data and Notation
- Fama-Bliss zero-coupon Treasury yields, 1 to 5 years, 1964 to 2025.
- The Treasury yield curve of Gürkaynak, Sack and Wright for longer maturities.
- Continuously compounded yields y_{t}(n), log prices p_{t}(n) = -n \, y_{t}(n), and forwards f_{t}(n - 1, n) = p_{t}(n - 1) - p_{t}(n).
- Hold an n-year bond for a year; its excess log return is \mathit{rx}_{t+1}(n) = p_{t+1}(n - 1) - p_{t}(n) - y_{t}(1).
Average Bond Returns
| Mean (%) | Volatility (%) | Sharpe ratio | |
|---|---|---|---|
| 2 years | 0.36 | 1.70 | 0.21 |
| 3 years | 0.68 | 3.12 | 0.22 |
| 4 years | 0.97 | 4.34 | 0.22 |
| 5 years | 1.04 | 5.38 | 0.19 |
- One-year excess returns of Fama-Bliss zeros, 1964 to 2024.
- A 10-year zero earned 2.7% a year over bills since 1971, a Sharpe ratio of 0.25 against 0.48 for stocks.
- A premium, but a small one per unit of risk, and inflated by four decades of falling rates.
Do Forward Rates Forecast Short Rates?
- Fama and Bliss (1987): regress the change in the one-year yield on the forward spread,
y_{t+n-1}(1) - y_{t}(1) = a + b \left( f_{t}(n - 1, n) - y_{t}(1) \right) + \varepsilon.
- The expectations hypothesis predicts b = 1.
- Or regress the bond’s excess return on the same spread,
\mathit{rx}_{t+1}(n) = a + b \left( f_{t}(n - 1, n) - y_{t}(1) \right) + \varepsilon.
- The expectations hypothesis predicts b = 0.
Two Sides of the Same Coin
- For the 2-year bond, the forward spread splits into the change in the short rate and the excess return: f_{t}(1, 2) - y_{t}(1) = \left( y_{t+1}(1) - y_{t}(1) \right) + \mathit{rx}_{t+1}(2).
- Regressing both sides on the forward spread, the two slopes add up to exactly one.
- Whatever the forward spread does not forecast about the short rate, it forecasts about the bond’s return.
Forward Rates Forecast Returns
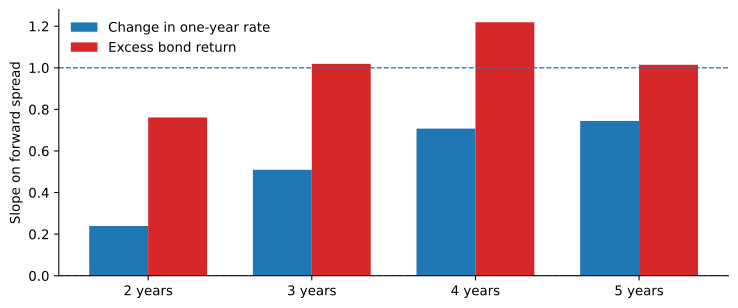
Slopes of the Fama-Bliss regressions on the forward spread, 1964 to 2025. The dashed lines are the predictions of the expectations hypothesis.
- Short-rate slopes rise with the horizon, 0.24 to 0.74; return slopes are 0.8 to 1.2, with t-statistics above 3.1.
Long Yields Move the Wrong Way
- Campbell and Shiller (1991): under the expectations hypothesis, a steep curve means the long yield should rise over the next year.
- Regress y_{t+1}(n - 1) - y_{t}(n) on (y_{t}(n) - y_{t}(1))/(n - 1): the hypothesis predicts a slope of one.
- The slopes are negative, from -0.52 at two years to -1.23 at five.
- A steep curve forecasts rising short rates over the long term, but a falling long yield over the short term.
- Both tests point to a time-varying term premium.
Example 1 (An Excess Bond Return) Zero prices are 0.96, 0.92 and 0.88 for one, two and three years, and a year later the two-year zero sells for 0.93. The one-year yield is -\ln 0.96 = 4.08\%, the forward rate f(2, 3) = \ln 0.92 - \ln 0.88 = 4.45\%, and the excess return of the three-year bond is \ln 0.93 - \ln 0.88 - 0.0408 = 1.44\%, well above the forward spread of 0.37%.
One Factor in Bond Risk Premia
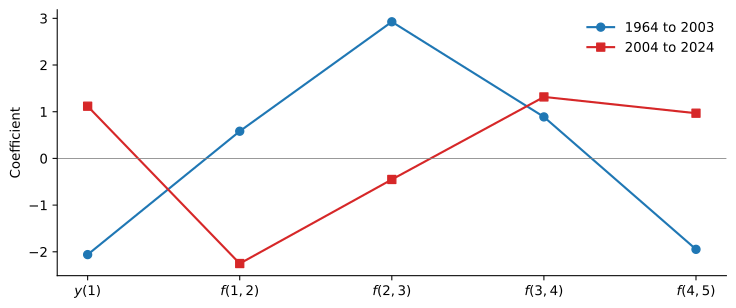
Coefficients of the regression of the average excess return of the two- to five-year bonds on the one-year yield and four forward rates.
- Cochrane and Piazzesi (2005): a tent-shaped combination of forwards, R^{2} up to 0.44; here 0.35 to 2003 and 0.21 after.
How Much to Trust the Forecasts?
- The forecasting variables are persistent and the returns overlap.
- Bauer and Hamilton (2018): the usual tests overstate the evidence that variables beyond level, slope and curvature forecast bond returns.
- The broad conclusion survives: forward rates forecast returns better than short rates, so term premia vary.
- Dai and Singleton (2002): models in which the price of interest rate risk varies with the state of the economy reproduce both puzzles.
Term Premia over Time
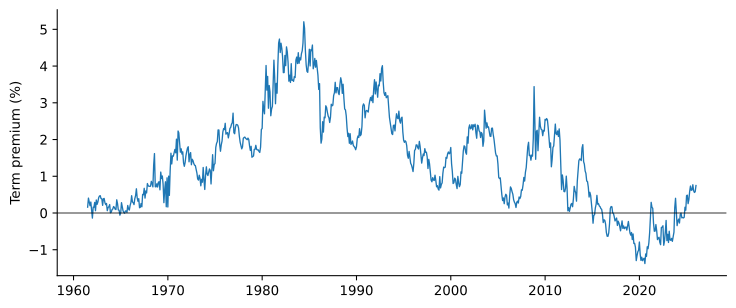
Estimated term premium in the 10-year Treasury yield, Adrian et al. (2013), published by the New York Fed.
- Peak 5.2% in May 1984, low -1.4% in July 2020, 0.75% at the end of 2025.
What Moves the Term Premium?
- Supply: Greenwood and Vayanos (2014): a longer maturity of Treasury debt relative to GDP raises yields and future excess returns.
- Federal Reserve purchases of long bonds after 2008 worked the other way.
- Safety and liquidity: Krishnamurthy and Vissing-Jorgensen (2012): Treasuries’ special value lowered their yields by 73 basis points on average, 1926 to 2008.
- Risk: how bonds do when other investments do badly.
Bonds as Hedges
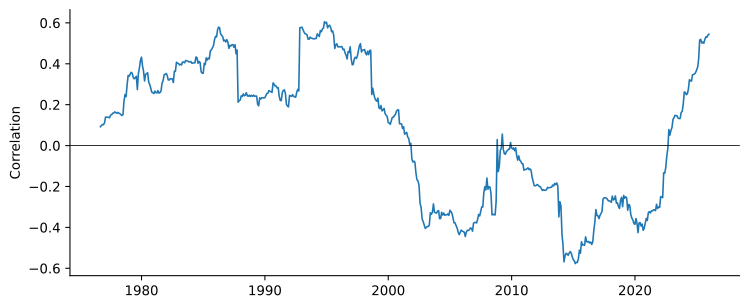
Correlation between the monthly excess returns of a 10-year zero and the stock market, rolling 60-month windows.
- 0.29 over 1971 to 1999 and -0.11 over 2000 to 2025; clearly positive again in 2024 and 2025.
Inflation Bets or Deflation Hedges?
- Campbell et al. (2017):
- Inflation risk: stocks and bonds fall together; bonds earn a high premium.
- Recession risk: bonds rise when stocks fall; bonds hedge and earn a low premium.
- Campbell et al. (2020): inflation and output became positively correlated in 2001.
- Pflueger (2025): bonds and stocks co-move with volatile supply shocks and an inflation-focused Fed.
- After the pandemic: negative betas through 2022, with a Fed that responded late.
Real Rates since 2021
- Nominal yield = real yield (TIPS) + breakeven inflation.
- Correlation of stock returns with monthly changes in 10-year yields:
| Nominal yield | Breakeven | Real yield | |
|---|---|---|---|
| 2010 to 2019 | 0.49 | 0.66 | 0.07 |
| 2021 to 2025 | -0.54 | 0.25 | -0.69 |
- Breakeven: 2.33% in 2025, as in 2003 to 2007. Real yield: -1.06% to 1.93% from 2020 to 2025.
- Higher real rates raise the discount rate on stocks and bonds alike.
Example 2 (Bonds in a 60/40 Portfolio) With 60% in stocks of volatility 16% and 40% in bonds of volatility 11%, the portfolio’s variance is 0.6^{2} \times 0.16^{2} + 0.4^{2} \times 0.11^{2} + 2 \times 0.6 \times 0.4 \times \rho \times 0.16 \times 0.11. With \rho = -0.3 its volatility is 9.3%; with \rho = +0.5 it is 12.4%.
Takeaways
- Long-term Treasuries have earned a premium over bills, small per unit of risk.
- Forward rates forecast bond returns better than short rates: the term premium varies.
- The forecasts are less reliable than their in-sample fit suggests.
- Term premia have ranged from about 5% to below zero, moved by supply, the special value of Treasuries and risk.
- Whether bonds hedge stocks depends on what moves yields in bad times.
- Since 2021: real yields, not expected inflation.