Skill versus Luck
Investment Theory
Fall 2026
Two Questions
- Does active management pay on average?
- Do funds that try to beat the market, taken together, beat a passive index after costs?
- Can we identify skilled managers?
- With thousands of funds, some will have spectacular records even if no one has any skill.
- Behind both: if some managers are skilled, competition for them may leave nothing for their investors.
The Average Fund: Classic Evidence
- Jensen (1968): funds could not beat buy-and-hold with the same beta, even before expenses.
- Malkiel (1995): every diversified equity fund, 1971 to 1991, including the dead ones; buy a low-cost index fund.
- Gruber (1996): funds trailed the market by 1.94% a year from 1985 to 1994, and a four-index model by 0.65%, with expenses of 1.13%.
- Wermers (2000), from holdings, 1975 to 1994:
- The stocks funds held beat the market by 1.3% a year, but net returns trailed it by 1%.
- Of the 2.3% gap, 0.7% came from cash and bonds and 1.6% from expenses and trading costs.
The Aggregate Active Fund
| CAPM \alpha | t(\alpha) | Four-factor \alpha | t(\alpha) | |
|---|---|---|---|---|
| Value-weighted, net | -1.29 | -4.09 | -1.19 | -4.04 |
| Value-weighted, gross | -0.42 | -1.31 | -0.32 | -1.07 |
| Equal-weighted, net | -1.61 | -3.54 | -1.46 | -4.27 |
| Equal-weighted, gross | -0.46 | -1.00 | -0.30 | -0.88 |
- 5,181 active U.S. equity funds in CRSP, 1984 to 2025, including dead funds. Alphas in percent per year.
- Before fees the aggregate fund roughly matches the market; after fees it trails by about the average expense ratio, 0.88% a year.
The Arithmetic of Active Management
- Index funds hold the market, so all other investors together also hold the market.
- Before costs, active investors as a group earn the market return; after costs, less.
- Active management is a zero-sum game before costs and a negative-sum game after them.
- This does not say no manager is skilled: skilled managers win at the expense of other active investors.
- The question is whether we can find the winners in advance.
Survivorship Bias
- Funds that do badly are merged or closed and disappear from databases of current funds.
- In our sample:
- Funds still alive in 2025: average net alpha -1.41% a year.
- Funds that disappeared: -2.26%. All funds: -1.92%.
- Brown et al. (1992): if funds differ in risk, survivorship alone creates spurious persistence.
Does Performance Persist?
- Malkiel (1995): winners repeated almost two-thirds of the time in the 1970s, just over half in the 1980s.
- Carhart (1997), 1962 to 1993: sort funds on last year’s return.
- The top decile beat the bottom by about 8% a year.
- Size, value and especially momentum explain 4.6%; expenses 0.7%; transaction costs 1%.
- The only persistence left is among the worst funds.
- Funds with the best past returns had ridden last year’s winning stocks, often by accident.
Persistence in Our Sample
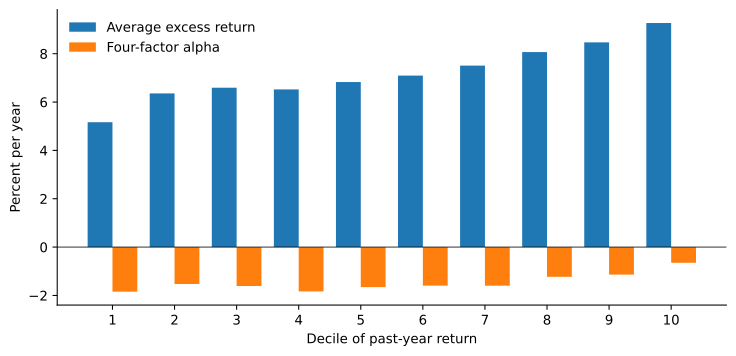
Average excess return and four-factor alpha, net of costs, of portfolios of active funds sorted each January on last year’s return. Decile 10 holds last year’s winners.
- Winners beat losers by 4.1% a year, but the spread’s momentum loading is 0.42 and its alpha only 1.2% (t = 0.72).
Luck in a Large Cross-Section
- With true alpha zero, t(\hat{\alpha}) \approx \mathit{IR} \sqrt{T} is roughly standard normal.
- The question is not whether the best funds have large t-statistics, but whether there are more large t-statistics than luck produces.
Example 1 (Counting Lucky Funds) A database holds 4,000 funds with no skill and independent normal t-statistics. Since 1 - \Phi(2) = 0.0228, about 4{,}000 \times 0.0228 = 91 funds will look significant. The probability that a fund has t > 3 is 0.00135, so the chance that at least one does is 1 - (1 - 0.00135)^{4{,}000} = 0.995. One fund with t > 3 would be impressive; among 4,000 it is almost certain.
Bootstrapping the Cross-Section
- Fund returns are not normal, histories differ in length, and funds are lucky or unlucky together.
- Kosowski et al. (2006): bootstrap each fund separately.
- 1,788 funds, 1975 to 2002: luck predicts 9 funds with alpha above 10% a year; 29 did.
- Fama and French (2010) change two things:
- Draw calendar months, the same months for all funds, to keep their correlation.
- Require only 8 months of returns, since a 5-year minimum keeps only survivors.
- The procedure: subtract each fund’s alpha, resample months, re-estimate every t(\alpha), record the percentiles, repeat.
The Bootstrap in Our Sample
| Net actual | Net luck | Net below | Gross actual | Gross luck | Gross below | |
|---|---|---|---|---|---|---|
| 1st | -3.90 | -2.45 | 0 | -3.10 | -2.48 | 2 |
| 5th | -3.05 | -1.68 | 0 | -2.39 | -1.69 | 1 |
| 10th | -2.61 | -1.30 | 0 | -1.98 | -1.30 | 0 |
| 50th | -1.09 | 0.01 | 0 | -0.34 | 0.01 | 4 |
| 90th | 0.50 | 1.32 | 0 | 1.32 | 1.34 | 51 |
| 95th | 0.98 | 1.72 | 0 | 1.79 | 1.73 | 63 |
| 98th | 1.55 | 2.19 | 0 | 2.37 | 2.19 | 79 |
| 99th | 1.98 | 2.54 | 0 | 2.71 | 2.52 | 78 |
- Percentiles of four-factor t(\alpha): actual, average of 1,000 no-skill runs, and percentage of runs below the actual value.
What the Bootstrap Says
- Net returns: every percentile is far below what luck produces. Even the 99th percentile, 1.98, is below luck’s 2.54.
- Gross returns:
- The left tail is much worse than luck: some managers lose money before fees.
- The right tail is close to luck: the 98th percentile is 2.37 against 2.19.
- Fama and French (2010): “the simulation results are disheartening” for investors.
- Gross, a standard deviation of true alpha of about 1.25% a year fits the tails: not much skill.
False Discoveries
- Barras et al. (2010): what fraction of funds have zero, positive or negative true alpha?
- Zero-alpha funds have uniform p-values, so large p-values come from them: \hat{\pi}_{0} = \frac{\#\{p_{i} > \lambda\}}{M (1 - \lambda)} \qquad \hat{\pi}^{+} = \frac{\#\{p_{i} < \gamma, \ t_{i} > 0\}}{M} - \hat{\pi}_{0} \frac{\gamma}{2}.
- 1975 to 2006: 75.4% zero alpha, 24.0% unskilled, 0.6% skilled (14.4% in 1990). Before expenses, 9.6% skilled.
- Our sample, \lambda = 0.5, \gamma = 0.2:
- Net: 57% zero alpha, 38% unskilled, 0% skilled.
- Gross: 79% zero alpha, 15% unskilled, 2% skilled.
Example 2 (How Many Funds Are Skilled?) Of 2,000 funds, 700 have p-values above 0.5, so \hat{\pi}_{0} = 700 / (2{,}000 \times 0.5) = 0.70. At \gamma = 0.10, 180 funds have significant positive alphas, of which 0.70 \times 2{,}000 \times 0.05 = 70 are expected to be lucky. The skilled fraction is (180 - 70) / 2{,}000 = 5.5\%.
Shrinking toward the Population
- Harvey and Liu (2018) estimate the cross-sectional distribution of true alphas and shrink each fund’s estimate toward it.
- A large estimated alpha more likely means a modest true alpha and a lucky draw, because large true alphas are rare.
- Shrinkage reduces errors in forecasting future alphas.
- Past fund performance predicts future outcomes poorly, and the reason is noise.
Skill in Equilibrium
- Berk and Green (2004):
- Managers differ in skill, and alpha before costs falls as a fund grows.
- Investors learn from returns and move money to any fund with positive expected net alpha.
- Money flows in until the expected net alpha is zero. With gross alpha \alpha(q) and fee f, \alpha(q^{*}) - f = 0 \qquad \text{value added} = q^{*} \alpha(q^{*}) = q^{*} f.
- Zero average net alpha and no persistence are exactly what the model predicts, with skilled managers.
Example 3 (A Fund in Equilibrium) Gross alpha is \alpha(q) = 3\% - 0.5\% \times q, with q in billions of dollars. With a 1\% fee, the fund grows to q^{*} = 4 billion, where 3 - 0.5 \times 4 = 1. Investors earn a net alpha of zero and the manager collects 4 \times 1\% = \$40 million a year. A 1.5\% fee gives q^{*} = 3 billion and $45 million, the most the manager can earn; investors still earn zero.
Flows Chase Performance
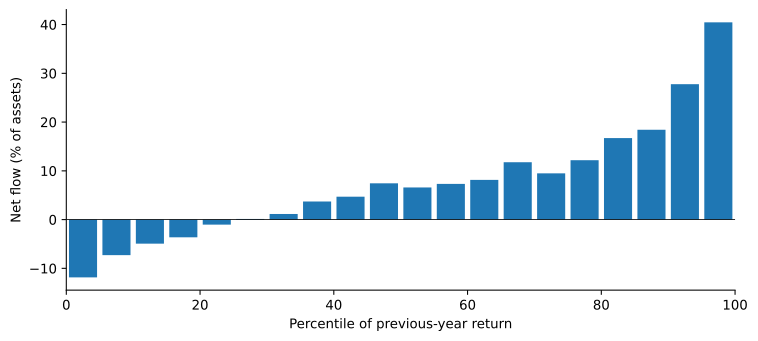
Average annual net flow into active U.S. equity funds, as a percentage of assets, by percentile of the previous year’s return.
- Top 5% of funds: 40% of assets in new money. Bottom 5%: -12%. Sirri and Tufano (1998) found the same convexity.
Is Berk and Green Right?
- Fama and French (2010): the average net alpha is negative, not zero, and most funds have negative true net alphas; the data reject most of the model’s predictions.
- Berk and Binsbergen (2015): measure skill by value added, gross alpha relative to Vanguard index funds times assets.
- The average fund added about $3.2 million a year, though the median fund lost value.
- Differences in value added persisted for up to ten years.
- Pástor et al. (2015): decreasing returns at the industry level.
- A 1 point rise in the industry’s share of the market lowers fund performance by almost 0.4% a year.
- Skill rose from 0.24% to 0.42% a month, 1979 to 2011, while performance stayed flat.
Looking Inside the Portfolio
- Active share (Cremers and Petajisto 2009):
\text{Active Share} = \frac{1}{2} \sum_{i} \left| w_{i} - w^{B}_{i} \right|.
- High active share funds beat benchmarks by about 1.1% a year after fees; closet indexers held 30% of assets in 2003.
- Frazzini et al. (2016): the result comes from small-cap benchmarks with poor returns; within benchmarks, active share does not predict performance.
- Return gap (Kacperczyk et al. 2008): fund return minus the return of its last disclosed holdings, net of expenses.
- It persists up to five years; top minus bottom deciles, about 3.4% a year.
Hedge Funds Are Harder
- Dynamic strategies, derivatives and leverage: stock factor models fit poorly.
- Illiquid holdings marked with stale prices.
- Voluntary reporting to databases.
Stale Prices and Smoothed Returns
- Asness et al. (2001): a hedge fund index’s beta rises from 0.37 to 0.84 with lagged market returns, and its alpha falls from 2.6% to about -4.5\% a year.
- Getmansky et al. (2004):
R^{o}_{t} = \theta_{0} R_{t} + \theta_{1} R_{t - 1} + \cdots + \theta_{k} R_{t - k} \qquad \theta_{0} + \cdots + \theta_{k} = 1.
- Same mean, lower volatility: \text{SR}^{o} = \text{SR} / \sqrt{\theta_{0}^{2} + \cdots + \theta_{k}^{2}}.
- Contemporaneous beta \theta_{0} \beta; summing lagged betas recovers \beta.
- Their main interpretation is illiquidity, not manipulation.
Example 4 (A Smoothed Fund) True Sharpe ratio 0.5, beta 0.8, and weights \theta = (0.5, 0.3, 0.2). The sum of squared weights is 0.38, so reported volatility is \sqrt{0.38} = 0.62 times the true one and the reported Sharpe ratio is 0.5 / 0.62 = 0.81. The contemporaneous beta is 0.4, and the lagged betas 0.24 and 0.16 sum back to 0.8. The first-order autocorrelation is 0.21 / 0.38 = 0.55.
Reporting Biases and What Investors Earn
- Aiken et al. (2013), from funds-of-funds filings, 2004 to 2009: funds that report to databases had a seven-factor alpha of 1.20% a quarter, those that did not 0.05%.
- Bollen and Pool (2009): far more small gains than small losses, a kink at zero that vanishes around audits.
- Skill: Kosowski et al. (2007) find 155 funds with t > 4.67 where luck predicts at most 3; Jagannathan et al. (2010) find a quarter to a third of alpha persists.
- Dichev and Yu (2011), 1980 to 2008: buy-and-hold 12.6% a year, dollar-weighted 6.0%, against 10.9% for the S&P 500 and 5.6% for T-bills.
Takeaways
- The average active fund trails an index fund by roughly its fees.
- Past winners keep winning only because their stocks have momentum.
- In net returns, the best records are what luck would produce. In gross returns there is some skill, but the right tail is thin.
- Competition can drive investors’ net alphas to zero even when managers are skilled.
- Hedge funds show more skill, but their data are harder to trust, and investors earned much less than the funds.