Credit Risk and Corporate Bonds
Investment Theory
Fall 2026
Corporate Bonds
- Promised fixed payments, like Treasuries, but the issuer can default.
- A claim on the firm’s cash flows, senior to its stock.
- Ratings: Baa/BBB and above is investment grade; below is high yield.
- The yield spread: the corporate yield minus the Treasury yield of the same maturity.
- This chapter:
- Promised yields and expected returns.
- A century of spreads, and how much of them is default.
- Corporate bond returns from transaction prices.
Promised Yields and Expected Returns
- A one-year zero with promised yield y, default probability \pi and recovery R of face value: \operatorname{E}(r) = (1 + y) \left( 1 - \pi (1 - R) \right) - 1 \approx y - \pi (1 - R).
- \pi (1 - R) is the expected default loss.
- The spread over Treasuries also pays for:
- a risk premium, because defaults cluster in bad times,
- a liquidity premium, because corporate bonds are costly to trade,
- taxes, since states tax corporate interest but not Treasury interest.
Example 1 (How Much of the Spread Is Expected Loss?) With Treasuries at 4.5%, a Baa bond yielding 6% with a 0.25% default probability and 40% recovery has an expected return of 1.06 \times (1 - 0.0025 \times 0.6) - 1 = 5.84\%: the expected loss is 0.16 of its 1.5-point spread. A B bond yielding 8.5% with a 4% default probability expects 1.085 \times (1 - 0.04 \times 0.6) - 1 = 5.90\%: the expected loss is 2.6 of its 4-point spread.
Spreads over a Century
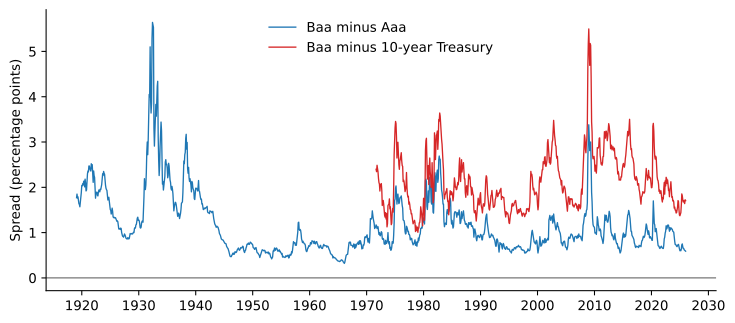
Moody’s Baa minus Aaa yields since 1919, and Baa minus the 10-year Treasury par yield since 1971, in percentage points.
- Baa-Aaa: mean 1.16, peak 5.64 in May 1932, 3.38 in December 2008, 0.59 at the end of 2025.
Spreads Are Not Default Forecasts
- Giesecke et al. (2011): U.S. corporate bond defaults, 1866 to 2008.
- Railroad crisis of 1873 to 1875: defaults of 36% of the par value of the market.
- Stock returns, volatility and GDP growth forecast defaults; credit spreads do not.
- Spreads are about twice default losses: a credit risk premium of about 80 basis points.
How Much of the Spread Is Default?
- Elton et al. (2001), 10-year A-rated industrials:
- Expected loss 17.8%, state and local taxes 36.1%, and a risk premium for the remaining 46%.
- Merton (1974): equity is a call on the assets; debt is a riskless bond minus a put.
- Huang and Huang (2012): structural models explain under 20% of investment-grade spreads, the credit spread puzzle.
- Chen et al. (2009): defaults and risk premia rise together in recessions, which shrinks the puzzle.
Evidence from Credit Default Swaps
- A credit default swap pays the loss on a bond if its issuer defaults, so its premium prices default alone.
- Longstaff et al. (2005): the default component of the spread over Treasuries is
- 51% for AAA and AA, 56% for A, 71% for BBB, 83% for BB.
- The rest varies with the illiquidity of bonds and of the bond market.
- Default risk is the largest part of the spread, much larger than the expected default loss.
Example 2 (Debt as a Riskless Bond Minus a Put) A firm with assets of $100 million owes $80 million in one year, the risk-free rate is 5%, and a one-year put on the assets with a strike of $80 million is worth $3 million. The debt is worth 80/1.05 - 3 = \$73.19 million and the equity $26.81 million. The promised yield is 80/73.19 - 1 = 9.30\%, a spread of 4.30 points. More volatile assets raise the put’s value and the spread.
Corporate Bond Returns
| Mean (%) | Volatility (%) | Sharpe ratio | Worst month (%) | |
|---|---|---|---|---|
| Investment grade | 3.11 | 5.87 | 0.53 | -6.08 |
| High yield | 4.98 | 7.87 | 0.63 | -14.22 |
| Stock market | 10.37 | 15.18 | 0.68 | -17.20 |
- Value-weighted portfolios from TRACE transaction prices (WRDS Bond Returns), September 2002 to December 2025, in excess of bills.
- Both had their worst month in March 2020, before the Fed announced it would buy corporate bonds.
What Risks Do They Carry?
| Alpha (%) | t(alpha) | MKT | TERM | R-squared | |
|---|---|---|---|---|---|
| Investment grade | -0.45 | -0.52 | 0.20 | 0.85 | 0.61 |
| High yield | 0.62 | 0.40 | 0.38 | 0.24 | 0.53 |
- Regressions on the stock market (MKT) and a 5-year Treasury (TERM).
- Investment grade: mostly Treasury risk; high yield: more equity-like, because default risk rises when stocks fall.
- No alpha is significant.
Factor Models for Bonds
- Fama and French (1993): a term factor and a default factor capture most of the variation in bond returns.
- Bai et al. (2019): downside, credit and liquidity risk factors, retracted in 2023.
- Dickerson et al. (2023) found the result came from misaligned dates in the data.
- With aligned data, the corporate bond market factor is hard to beat.
- A replication lesson: when returns are built from complex data, the alignment of dates is part of the result.
Spreads and the Economy
- Collin-Dufresne et al. (2001): leverage, volatility and interest rates explain little of the changes in spreads; a single common factor drives most of the rest.
- Gilchrist and Zakrajšek (2012): split spreads into expected defaults and an excess bond premium.
- The excess bond premium rises when financial intermediaries lose capital.
- It predicts declines in economic activity: a contraction in the supply of credit.
Reaching for Yield
- A higher promised yield is not a higher expected return if it comes with more default risk.
- Choi and Kronlund (2018): corporate bond funds that tilt toward higher-yield bonds
- earn higher returns and attract more inflows, especially when rates are low,
- but tend to have negative risk-adjusted returns,
- and hold less cash and less liquid bonds.
- The right benchmark has the same exposure to default risk.
Takeaways
- A corporate yield is a promise; the expected return is lower by the expected default loss.
- For investment-grade bonds, expected losses are a small part of the spread; default risk, liquidity and taxes make up the rest.
- Spreads widen in crises and leave a long-run credit risk premium of about 80 basis points.
- Investment-grade returns are mostly Treasury risk; high-yield returns are more equity-like.
- Single-factor bond models are hard to beat, and data errors can create the appearance of more.