CAPM Anomalies
Investment Theory
Fall 2026
What Is an Anomaly?
- The CAPM says that the expected excess return of any asset is its beta times the market risk premium.
- Nothing else about the asset should matter.
- Every asset has an alpha of zero relative to the market.
- An anomaly is a characteristic of a firm, observable in advance, that predicts its future returns beyond what its beta predicts.
- Every anomaly is a rejection of a joint hypothesis: markets are efficient and the CAPM describes expected returns.
- At the end we ask what anomalies mean: missing risk, investor mistakes, or data mining.
Two Ways to Test the CAPM
- The time-series test runs the index-model regression for each asset, R_{i,t} = \alpha_{i} + \beta_{i} R_{M,t} + e_{i,t}, \tag{1} and checks whether every \alpha_{i} is zero.
- The cross-sectional test regresses average excess returns on betas,
\overline{R}_{i} = \gamma_{0} + \gamma_{1} \beta_{i} + u_{i}.
- The CAPM predicts \gamma_{0} = 0, \gamma_{1} = \operatorname{E}(R_{M}), and no role for any other characteristic.
Black et al. (1972)
- Individual stock betas are estimated with a lot of noise, which biases the slope toward zero.
- Their solution: sort stocks into ten portfolios on past betas and test the portfolios.
- Portfolio betas are estimated far more precisely.
- With NYSE stocks from 1931 to 1965:
- Low-beta portfolios earned more than the CAPM predicts.
- High-beta portfolios earned less.
- The security market line was flatter than the theory says.
Fama and MacBeth (1973)
- Run a cross-sectional regression every month, R_{i,t} = \gamma_{0,t} + \gamma_{1,t} \beta_{i} + \gamma_{2,t} z_{i,t-1} + u_{i,t}, where z_{i,t-1} is any characteristic known before month t.
- Average the monthly slopes, and measure their precision from their month-to-month variation: \hat{\gamma}_{k} = \frac{1}{T} \sum_{t = 1}^{T} \hat{\gamma}_{k,t} \qquad t(\hat{\gamma}_{k}) = \frac{\hat{\gamma}_{k}}{s(\hat{\gamma}_{k,t}) / \sqrt{T}}. \tag{2}
- Each monthly slope is the return on a portfolio, so this is the usual test of whether an average return is zero.
Decile Sorts
- Most of the evidence uses a simpler tool:
- Sort stocks into ten portfolios on a characteristic.
- Compute the average excess return of each decile.
- Compare it with the CAPM prediction \beta_{i} \overline{R}_{M}.
- If the characteristic is an anomaly, the deciles drift away from the security market line in a systematic way.
- The data are value-weighted decile portfolios from Kenneth French’s data library, July 1963 to September 2026.
The Flat Security Market Line
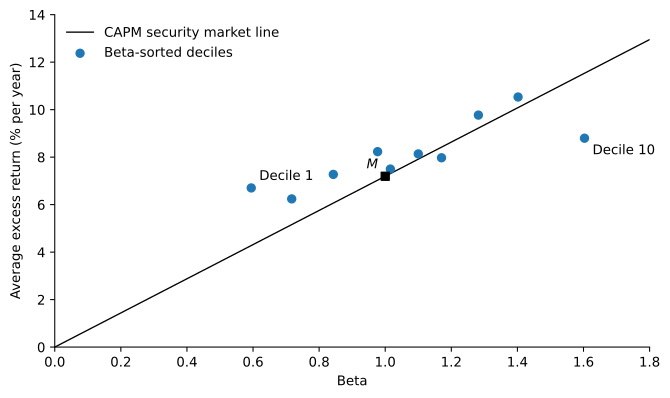
Average annual excess returns of ten portfolios sorted on past beta, against their betas. The line is the CAPM security market line through the market portfolio M.
Beta Barely Matters
- Betas range from 0.59 to 1.60, but average returns barely respond.
- Lowest-beta decile: 6.7% a year, against 4.3% predicted.
- Highest-beta decile: 8.8% a year, against 11.5% predicted.
- Long the lowest decile and short the highest: CAPM alpha of 5.2% a year, t = 2.10.
- A flat line does not mean beta is irrelevant.
Example 1 (Leverage and the Flat Line) A low-beta portfolio L has beta 0.6 and average excess return 6.7\%, and a high-beta portfolio H has beta 1.6 and 8.8\%. An investor who wants a beta of 1.6 can buy H and expect 8.8\%. Or the investor can put 1.6 / 0.6 = 2.667 times their wealth in L, borrowing the rest, and expect 2.667 \times 6.7\% = 17.9\%. If borrowing costs 2\% over the risk-free rate, the levered position still expects 17.9\% - 1.667 \times 2\% = 14.5\%. Investors who cannot borrow at all must buy H, and their demand keeps high-beta stocks expensive.
Anomalies in Decile Sorts
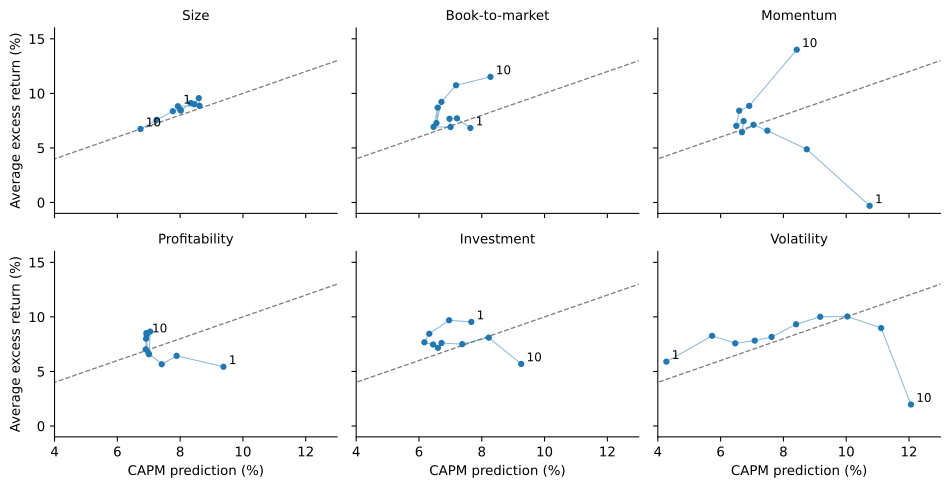
Average annual excess returns of decile portfolios against the CAPM prediction from their betas. Deciles go from low (1) to high (10) values of the characteristic. Under the CAPM the points lie on the dashed line.
Long-Short Spreads
| Mean (%) | Beta | Alpha (%) | t(alpha) | |
|---|---|---|---|---|
| Small minus big | 2.09 | 0.17 | 0.89 | 0.43 |
| High minus low B/M | 4.69 | 0.09 | 4.05 | 1.88 |
| Low minus high beta | -2.09 | -1.01 | 5.16 | 2.10 |
| Winners minus losers | 14.31 | -0.32 | 16.64 | 5.23 |
| Short-term reversal | 3.12 | 0.40 | 0.26 | 0.11 |
| Robust minus weak profitability | 2.91 | -0.34 | 5.35 | 3.02 |
| Conservative minus aggressive | 3.85 | -0.22 | 5.44 | 3.61 |
| Low minus high accruals | 3.40 | -0.07 | 3.92 | 3.05 |
| Low minus high volatility | 3.93 | -1.08 | 11.72 | 3.93 |
- Each spread buys the decile the anomaly favors and sells the other end. Mean and alpha are in percent per year.
Size
- Banz (1981): small firms had higher risk-adjusted returns than large firms, 1936 to 1975.
- Since 1963, small stocks also have higher betas, and the CAPM explains most of their extra return.
- The small-minus-big alpha is only 0.9% a year.
- The effect weakened after it was published:
- July 1926 to December 1980: 10.3% a year.
- January 1981 to September 2026: -0.9% a year.
Value
- Basu (1977): low price-earnings stocks earned more than their risk justified, 1957 to 1971.
- The book-to-market ratio (B/M) generalizes the idea.
- High B/M: cheap relative to accounting value, a value stock.
- Low B/M: a growth stock.
- Value and growth deciles have similar betas, but very different returns.
- The high-minus-low spread earns 4.1% a year more than the CAPM predicts.
Beta, Size and Value Together
- Fama and French (1992), 1963 to 1990: size and B/M capture the variation in average returns associated with beta, size, leverage, B/M and earnings-price ratios.
- Once beta is allowed to vary independently of size, the relation between beta and average return is flat.
- Their method:
- Each June, sort stocks into ten size deciles, then each size decile into ten deciles of past beta.
- Give each stock the full-sample beta of its portfolio among the 100.
Within Size, Beta Is Not Priced
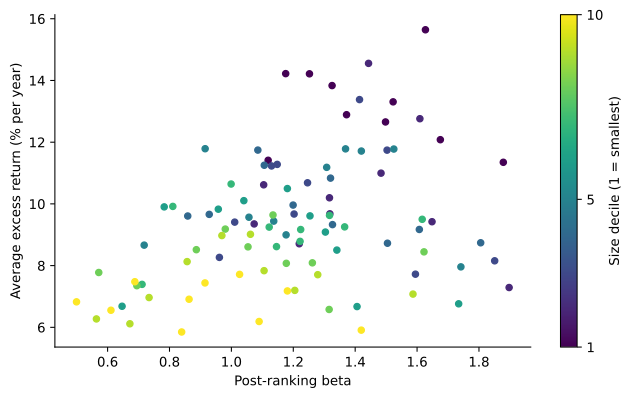
Average annual excess returns of 100 portfolios formed on size and, within size deciles, on past beta, against their betas. Darker points are smaller firms.
Fama-MacBeth Slopes
| Beta | \ln(ME) | \ln(BE/ME) | |
|---|---|---|---|
| Beta alone | 0.19 (0.81) | ||
| Size alone | -0.11 (-3.15) | ||
| B/M alone | 0.33 (6.33) | ||
| Beta and size | -0.15 (-0.68) | -0.13 (-3.88) | |
| Beta, size and B/M | -0.02 (-0.12) | -0.09 (-2.53) | 0.24 (4.89) |
- Average monthly slopes in percent, t-statistics in parentheses, July 1963 to December 2025.
- Beta alone: slope 0.19% a month, t = 0.81. Size and B/M are significant, and they push the slope on beta to essentially zero.
Momentum and Reversal
- Jegadeesh and Titman (1993): stocks that did well over the past 3 to 12 months keep doing well over the next 3 to 12 months.
- Our momentum deciles rank on returns from 12 months to 2 months before formation.
- Past losers have higher betas, so the CAPM makes the anomaly larger.
- Winners minus losers: beta -0.32, alpha 16.6% a year, t = 5.23.
- The most recent month is skipped because one-month returns tend to reverse (Jegadeesh 1990).
Profitability, Investment, Accruals, Volatility
- Profitability (Novy-Marx 2013): profitable firms earn higher returns despite higher valuation ratios.
- Investment (Titman et al. 2004): firms that increase investment substantially earn lower returns.
- Accruals (Sloan 1996): investors fixate on earnings and miss that accruals persist less than cash flows.
- Volatility (Ang et al. 2006): high-volatility stocks have low average returns.
- High-volatility stocks are also high-beta stocks, a close relative of the flat security market line.
Long-Short Returns over Time
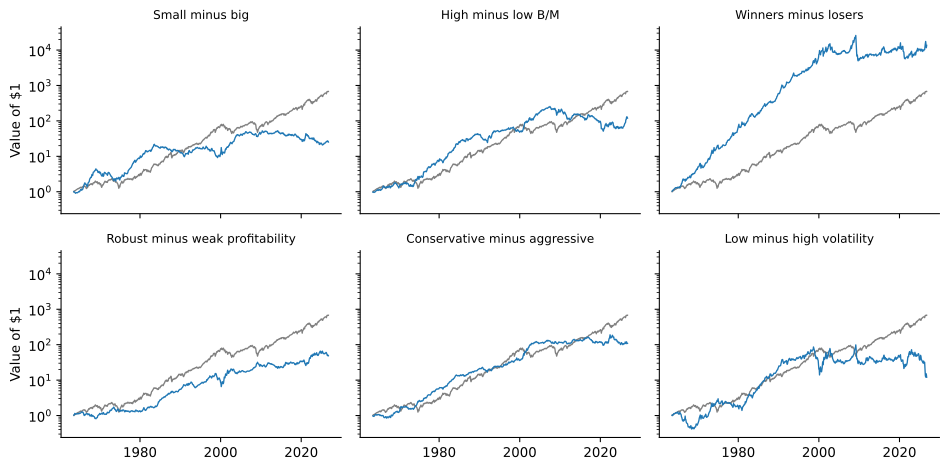
Growth of $1 invested in T-bills plus each long-short spread, on a log scale. The gray line is $1 in the market.
Large Alphas, Large Swings
- Anomalies are much stronger in some decades than in others.
- The value spread had its best years from 2000 to 2006 and has lost money on average since 2007.
- Momentum, the strategy with the largest average return, also had the largest loss.
- In 2009 the past losers it was short rebounded with the market.
- An anomaly can have a large alpha and still be a risky strategy.
Example 2 (The Alpha of Momentum) A winners-minus-losers portfolio earns 1.2\% a month and has a market beta of -0.3, and the market risk premium is 0.5\% a month. Its CAPM alpha is 1.2\% - (-0.3)(0.5\%) = 1.35\% a month, more than its average return, because a negative beta makes it a partial hedge. But in a month when the market rebounds 20\% after a crash, its market exposure alone costs -0.3 \times 20\% = -6\%.
Risk, Mispricing or Data Mining?
- Missing risk factors. The CAPM may be the wrong model of risk.
- Mispricing. Investors may make systematic mistakes.
- Data mining. Researchers have tested hundreds of characteristics.
- Harvey et al. (2016): a new factor needs t > 3.0, not 2.0.
Example 3 (How Many False Discoveries?) Researchers test 300 characteristics, none of which truly predicts returns. With the cutoff |t| > 1.96 they expect 300 \times 0.05 = 15 false discoveries. With |t| > 3.0, which a standard normal exceeds with probability 0.27\%, they expect 300 \times 0.0027 = 0.81. Evidence from a sample that starts after the original study is more convincing still, because no one could have searched over returns that did not yet exist.
Takeaways
- The security market line is too flat: low-beta stocks earn too much and high-beta stocks too little.
- Value, momentum, profitability, investment, accruals and volatility all produce large CAPM alphas.
- Most of these spreads remain significant decades after the original studies.
- The size effect is the main exception: strong before 1981, weak since.
- Whether anomalies reflect risk or mispricing is the question for the next chapters.