Bond Pricing
Investment Theory
Fall 2026
Bonds
- A bond is a promise to make a fixed schedule of payments.
- The U.S. Treasury borrows with bills, notes and bonds; so do corporations, states and cities, and mortgage agencies.
- Because the payments are fixed, the price depends only on how the market discounts money at each future date.
- This chapter:
- Pricing a bond from its yield, and from zero-coupon bonds.
- The actual Treasury yield curve.
- Holding-period returns and the conventions of bond quotes.
Bonds Paying Annual Coupons
Pricing a Bond Paying Annual Coupons
- An annual-paying coupon-bond pays a periodic amount C every year, and its principal or face-value F at maturity, as shown in the figure below.

- Usually, the coupon is expressed as a percentage of the face value of the bond.
- The ratio C/F is called the coupon rate and is expressed as a percent.
- Most bonds are issued in $1,000 denominations in which case we have F = \$1{,}000.
The Yield-to-Maturity
- The constant discount rate that prices the bond correctly is called the yield-to-maturity (YTM).
- For valuation purposes, in the case of annual paying coupon bonds it is customary to express the YTM per year compounded annually.
- If we denote by y the YTM per year compounded annually, we have that:
\begin{aligned}
B & = \frac{C}{(1+y)} + \frac{C}{(1+y)^{2}} + \cdots + \frac{C}{(1+y)^{T-1}} + \frac{C + F}{(1+y)^{T}} \\
& = \frac{C}{y} \left( 1 - \frac{1}{(1+y)^{T}} \right) + \frac{F}{(1+y)^{T}},
\end{aligned}
where in the second line I have used the formula for the present value of an annuity.
- Financial calculators can perform these computations easily.
Example 1 (Computing a Bond Price) Consider a bond paying annual coupons with a coupon rate of 5% per year over a principal of $1,000 and maturity 30 years. The YTM is 6% per year with annual compounding. To compute the bond’s price, we could use a financial calculator:
| N | I/Y | PV | PMT | FV | |
|---|---|---|---|---|---|
| Given: | 30 | 6 | 50 | 1000 | |
| Solve for: | -862.35 |
The price is then $862.35. The negative sign provided by the financial calculator represents the fact that if we pay $862.35 today, we are entitled to be paid every year $50 for 30 years, and $1,000 at the end of 30 years.
Example 2 (Computing a YTM) Consider a bond paying annual coupons with a coupon rate of 6.5% per year over a principal of $1,000 and maturity 25 years. The bond trades for $1,020. To compute the YTM, we could use a financial calculator:
| N | I/Y | PV | PMT | FV | |
|---|---|---|---|---|---|
| Given: | 25 | -1020 | 65 | 1000 | |
| Solve for: | 6.34 |
The YTM is then 6.34% per year with annual compounding.
Bond Values
- Most bonds are issued at or close to par value.
- The coupon rate is chosen to be the par yield of the bond.
- As time passes, though, the price of the bond might increase if yields decrease or decrease if yields increase.
- A bond is said to trade at a premium if its flat price is greater than its face value, and at a discount if the quoted price is less than par value.
- The current yield is the annual coupon payment divided by the quoted price.
- Away from par, the YTM equals the current yield only when the bond is a perpetuity.
- For long maturity bonds the current yield is a good approximation of the YTM.
Example 3 (Current Yield vs YTM) Consider a 3-year, annual paying coupon bond, with coupon rate of 8% and face value of $1,000. The table below displays the current yield and YTM for different values of the bond price.
| Price | Coupon rate | Current Yield | YTM | |
|---|---|---|---|---|
| Premium Bond | 1,100 | 8% | 7.27% | 4.37% |
| Par bond | 1,000 | 8% | 8.00% | 8.00% |
| Discount Bond | 900 | 8% | 8.89% | 12.18% |
We can see that for short-term bonds the current yield is in general not a good approximation of the YTM.
Example 4 (Current Yield of a Long Term Bond) Consider a 30-year, annual paying coupon bond, with coupon rate of 8% and face value of $1,000. The table below displays the current yield and YTM for different values of the bond price.
| Price | Coupon rate | Current Yield | YTM | |
|---|---|---|---|---|
| Premium Bond | 1,100 | 8% | 7.27% | 7.18% |
| Par bond | 1,000 | 8% | 8.00% | 8.00% |
| Discount Bond | 900 | 8% | 8.89% | 8.97% |
We can see that for a long-term bond the current yield approximates the YTM well.
Using Zero Rates to Price a Bond
- In general, bonds with different maturities and coupon rates will have different YTM.
- The standard way to harmonize this problem is to use zero rates to price each cash flow at the right maturity and use the resulting price to compute the YTM.
- In these notes, we will denote by Z_{t}(n) the price of a zero coupon bond at time t expiring at time t + n.
Example 5 (Pricing Zero-Coupon Bonds) The table below presents zero rates for different maturities expressed per year with annual compounding.
| Maturity (years) | 1 | 2 | 3 | 4 | 5 | 6 |
|---|---|---|---|---|---|---|
| Zero Rate (%) | 2.0 | 3.0 | 3.5 | 4.0 | 4.3 | 4.5 |
If the face value of each zero-coupon bond is $1,000, then \begin{aligned} Z_{0}(3) & = \frac{1000}{1.035^3} = \$901.94, \\ Z_{0}(5) & = \frac{1000}{1.043^5} = \$810.17, \\ Z_{0}(6) & = \frac{1000}{1.045^6} = \$767.90. \end{aligned}
Example 6 (Pricing a Coupon Bond with Zero Rates) We can use the zero rates of Example 5 to compute the price and YTM of a coupon bond. Consider a bond paying annual coupons of 4% per year over a principal of $1,000 and maturity 6 years.
| Maturity (years) | 1 | 2 | 3 | 4 | 5 | 6 |
|---|---|---|---|---|---|---|
| CF | 40 | 40 | 40 | 40 | 40 | 1040 |
| DCF | 39.22 | 37.70 | 36.08 | 34.19 | 32.41 | 798.61 |
The bond price is $978.21, and its YTM is 4.42% per year:
| N | I/Y | PV | PMT | FV | |
|---|---|---|---|---|---|
| Given: | 6 | -978.21 | 40 | 1000 | |
| Solve for: | 4.42 |
Zero Yields and the Treasury Curve
Continuously Compounded Yields
- The continuously compounded yield of a zero paying $1 in n years: Z_{t}(n) = e^{-n \, y_{t}(n)}, \qquad y_{t}(n) = -\frac{1}{n} \ln Z_{t}(n).
- A rate Y with annual compounding is the same bond as y = \ln(1 + Y), since (1 + Y)^{n} = e^{n y}.
- 3.5% annually is \ln(1.035) = 3.44\% continuously compounded.
- Logs turn products into sums: log returns add up, and \ln Z_{t}(n) = -n \, y_{t}(n) is linear in the yield.
- The standard in research on the term structure.
The Term Structure
- The zero yields y_{t}(n) for all maturities on a date are the term structure of interest rates; their graph is the yield curve.
- The Treasury issues few zeros, so zero yields are inferred from coupon notes and bonds.
- Gürkaynak et al. (2007): every day since 1961, the Federal Reserve Board fits a smooth curve to off-the-run notes and bonds.
- It excludes bills, securities with less than three months left, and the most recently issued ones, which trade at a liquidity premium.
The Yield Curve on Four Dates
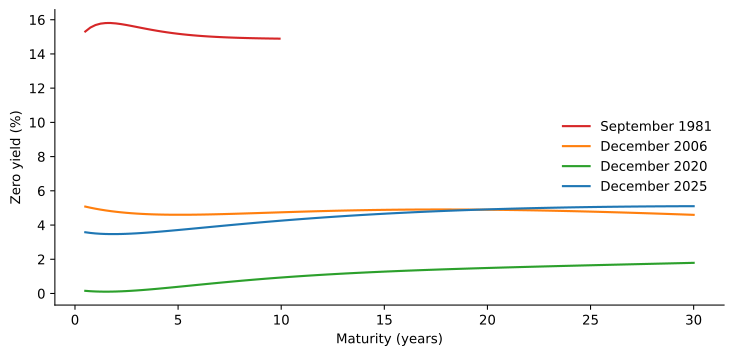
Continuously compounded zero-coupon Treasury yields on four dates. In 1981 the curve extends only to 10 years.
Treasury Yields since 1961
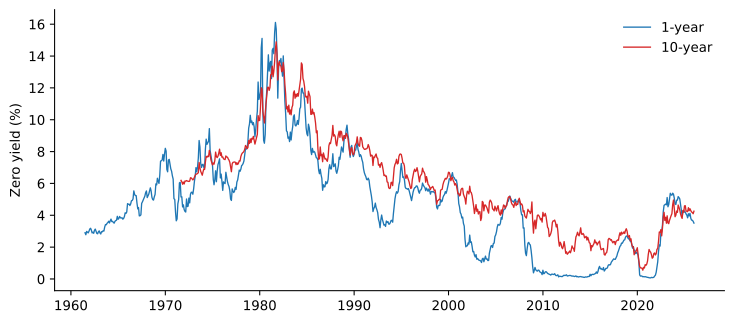
Continuously compounded 1-year and 10-year zero-coupon Treasury yields, month-end, 1961 to 2025.
- The long yield is usually above the short one; inversions have often preceded recessions.
Example 7 (Pricing a Note off the Yield Curve) On December 31, 2025, a 10-year note with a 4% coupon pays $20 every six months and $1,000 at maturity. Discounting each payment at the zero yield of its date gives $981.33, a yield to maturity of 4.231%. The coupon that prices a 10-year note at par is 4.228%, matching the 4.228% par yield the Federal Reserve publishes.
Holding Period Return
- The holding period return (HPR) is the net return of purchasing a bond over a period of time.
- It is usually expressed in annualized form. For a bond that pays coupons annually, the HPR at time t is defined as: R_{t+1} = \frac{B_{t+1} + C}{B_{t}} - 1, where B_{t} denotes the price of the bond at time t, B_{t+1} denotes the price of the bond a period later just after paying its coupon C.
- The HPR is not known at time t since we do not know the price of the bond a period later.
Example 8 (Holding Period Return on a Zero-Coupon Bond) Suppose that a 3-year zero-coupon bond with face value $1,000 has a YTM of 5% per year compounded annually. The bond’s current price is: Z_{0}(3) = \frac{1000}{(1.05)^{3}} = \$863.84.
If next year the YTM changes to 7%, the new bond price will be: Z_{1}(2) = \frac{1000}{(1.07)^{2}} = \$873.44. Notice that the zero-coupon bond next year has two years until maturity. The realized (holding period) return over the one year period is then: R_{1} = \frac{873.44}{863.84} - 1 = 1.11\%.
Example 9 (Holding Period Return on a Coupon Bond) A 4-year coupon bond has face value $1,000, coupons paid every year of $80, and a YTM of 8% per year with annual compounding. Since the YTM equals the coupon rate, the bond trades at par, that is B_{0} = \$1{,}000.
If the YTM stays at 8% per year, the bond price next year will also be par value, providing an annual return of 8% per year.
If next year the interest rate falls to 4%, the new bond price will be: B_{1} = \frac{80}{0.04} \left( 1 - \frac{1}{1.04^3} \right) + \frac{1000}{1.04^3} = \$1{,}111.00. The realized (holding period) return over the one year period is then: R_{1} = \frac{1111 + 80}{1000} - 1 = 19.10\%.
Bonds Paying Semi-Annual Coupons
Street Conventions
- Most bonds in the U.S. such as Treasuries pay coupons twice per year.
- If the coupon rate of the bond is expressed per year, then the semi-annual coupon payment is equal to half the annual coupon rate times the par-value of the bond.
- The YTM of semi-annual paying coupon bonds is usually quoted as per year with semi-annual compounding.
- The par yield of a bond is the coupon rate that makes the bond trade at par.
Example 10 (Pricing a Semi-Annual Coupon Bond) Consider a bond paying semi-annual coupons with a coupon rate of 5% per year over a principal of $1,000 and maturity 30 years. The YTM is 6% per year with semi-annual compounding. To compute the bond’s price, we could use a financial calculator as follows:
| N | I/Y | PV | PMT | FV | |
|---|---|---|---|---|---|
| Given: | 60 | 3 | 25 | 1000 | |
| Solve for: | -861.62 |
Note that to solve for the bond price we use 60 semi-annual periods, the annual YTM is divided by 2 since it is compounded semi-annually and the semi-annual payment is 2.5% of the face value. The price is then $861.62.
Example 11 (Computing a Par Yield) Consider a bond paying semi-annual coupons with a coupon rate of C\% per year over a principal of $1,000 and maturity 3 years. The table below presents zero rates for different maturities expressed per year with annual compounding.
| Maturity (years) | 0.5 | 1 | 1.5 | 2 | 2.5 | 3 |
|---|---|---|---|---|---|---|
| Zero Rate (%) | 2.0 | 3.0 | 3.5 | 4.0 | 4.3 | 4.5 |
The par yield C is such: \frac{C/2}{1.02^{0.5}} + \frac{C/2}{1.03^{1}} + \frac{C/2}{1.035^{1.5}} + \frac{C/2}{1.04^{2}} + \frac{C/2}{1.043^{2.5}} + \frac{100 + C/2}{1.045^{3}} = 100. If we denote A = \frac{1}{1.02^{0.5}} + \frac{1}{1.03^{1}} + \frac{1}{1.035^{1.5}} + \frac{1}{1.04^{2}} + \frac{1}{1.043^{2.5}} + \frac{1}{1.045^{3}} and D = \frac{1}{1.045^{3}}, the par yield solves 100 = \frac{C}{2} A + 100 D. Thus, C = \frac{2 (100 - 100 D)}{A} = 4.41. The 3-year par yield for a semi-annual paying coupon bond is therefore 4.41% per year.
Price vs. Yield
- Bond prices and yields move inversely: this 30-year, 5% coupon bond trades at a premium below a 5% YTM, at par at 5%, and at a discount above it.
- The relationship is convex, not linear.

Figure 1: The figure shows the price of a 30-year bond paying semi-annual coupons of 5% per year over a notional of $1,000, as a function of the YTM.
Flat vs. Invoice Prices
- If a bond is purchased between coupon payments, we need to use the exact timing of the cash flows to compute the invoice price.
- Let D be the number of days between coupon payments, and denote by d the number of days since the last coupon payment.
- For a bond paying k coupons per year and having N coupons left, paying an annual coupon of C and face value F we must have that: \begin{aligned} \text{Invoice Price} & = \frac{C/k}{(1+y/k)^{1-d/D}} + \frac{C/k}{(1+y/k)^{2-d/D}} + \cdots + \frac{C/k + F}{(1+y/k)^{N-d/D}} \\ & = \left[ \frac{C/k}{y/k} \left( 1 - \frac{1}{(1+y/k)^{N}} \right) + \frac{F}{(1+y/k)^{N}} \right] \times (1+y/k)^{d/D}, \end{aligned} where y is the YTM of the bond expressed per year and compounded k times per year.
The Pull-to-Par Effect
- As a bond approaches maturity, its price approaches par value, whatever its coupon rate.

Figure 2: The figure shows the evolution of the invoice price of a 10-year semi-annual paying coupon bond for different values of the coupon rate assuming that the YTM stays at 5% per year with semi-annual compounding. As the bond approaches maturity, the invoice price approaches par value. This is knows as the pull-to-par effect.
Accrued Interest
- The accrued interest of the bond is defined as: \text{Accrued Interest} = \frac{C}{k} \times \frac{d}{D}.
- The quoted or flat price of the bond is then defined as the difference between the invoice price and the accrued interest: \text{Flat Price} = \text{Invoice Price} - \text{Accrued Interest}.
Example 12 (Accrued Interest) Consider a bond with a coupon rate of 8% per year, paying semi-annual coupons over a notional of $1,000. If 30 days have elapsed since the last coupon payment, and there are 182 days in the semi-annual coupon period, the accrued interest on the bond is 40 \times (30/182) = \$6.59. If the quoted price on the bond is $995, then the invoice price will be 995 + 6.59 = \$1{,}001.59.
Example 13 (The Flat Price in Practice) The Excel formula PRICE computes the flat price using the above expressions. The PRICE function syntax has the following arguments:
- Settlement: The security’s settlement date. The security settlement date is the date after the issue date when the security is traded to the buyer.
- Maturity: The security’s maturity date. The maturity date is the date when the security expires.
- Rate: The security’s annual coupon rate. It has to be entered as a percent or decimal.
- Yld: The security’s annual yield. It has to be entered as a percent or decimal.
- Redemption: The security’s redemption value per $100 face value. The Excel formula assumes that the coupon rate is paid over a notional of $100. Therefore, to price a bond that pays the face value in full we set the redemption equal to 100.
- Frequency: The number of coupon payments per year. For annual payments, frequency = 1; for semiannual, frequency = 2; for quarterly, frequency = 4.
- Basis: The type of day count basis to use.
This function provides the flat price according to the street convention, which simplifies the timing of the cash flows regardless of whether they fall on a workday or a holiday. The typical day count for Treasury securities is Actual/Actual whereas for corporate bonds is 30/360.
Example 14 (The Flat Price of a Treasury Note) Consider a Treasury Note for which we have the following information:
- Settlement date: 7/21/2017
- Maturity date: 5/15/2027
- Coupon rate: 2.375%
- Yield-to-maturity: 2.400%
Using the above parameters, and a redemption of 100, frequency of 2 and basis equal to 1, the Excel function PRICE gives a flat price of $99.78084174.