Beta Pricing
Investment Theory
Fall 2026
Adding a Risk-Free Asset
- Adding a risk-free asset allows us to generate a CAL for each risky portfolio in our original investment opportunity set.
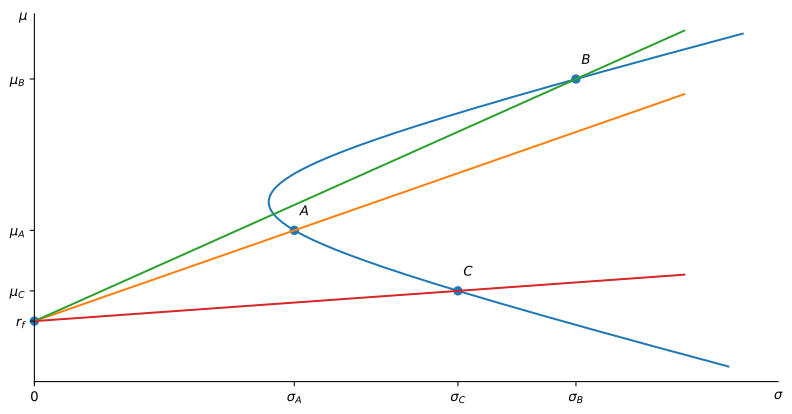
Figure 1: The figure shows the capital allocation lines of portfolios A, B, and C that are members of the same investment opportunity set of risky assets.
The Tangency Portfolio
- There is one portfolio Q that achieves the highest Sharpe ratio.
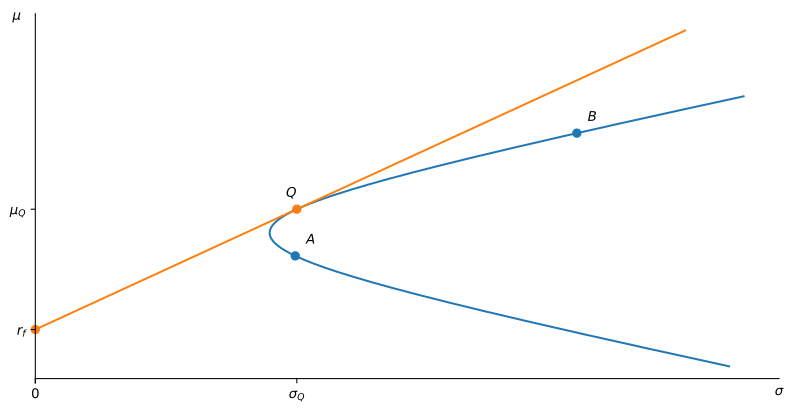
Figure 2: The figure shows the capital allocation line of the tangency portfolio.
The New Investment Opportunity Set
- Shorting Q to invest more than 100% in the risk-free asset traces a mirror-image line through r_{f}.
- Together with the CAL of Q, it encloses the hyperbola: once the risk-free asset is available, the opportunity set is a triangle.
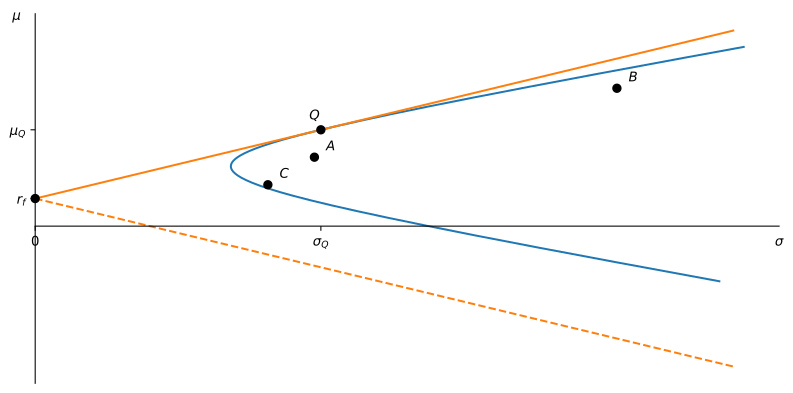
Figure 3: The CAL of Q and its mirror image, obtained by shorting Q, enclose the risky-asset hyperbola.
Mean-Variance Investors Like Efficient Portfolios
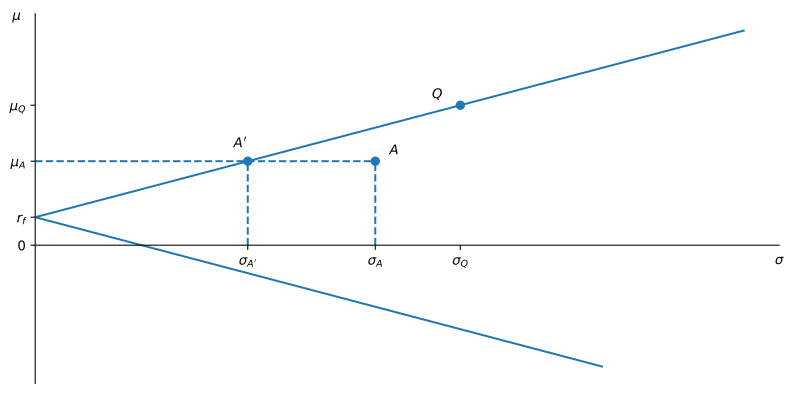
Figure 4: The figure shows the investment opportunity set available to an investor. The upper line determines the efficient frontier whereas the lower line is the set of inefficient portfolios. For a given portfolio A, there is a portfolio A' that has the same expected return as A but the lowest standard deviation. Both A' and Q are efficient portfolios.